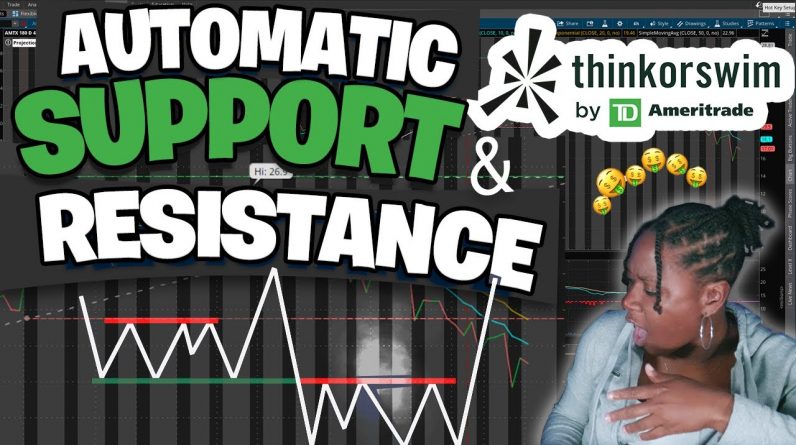
The Support and Resistance zones are some of the best indicators in stock trading. This indicator will automatically map out support and resistance zones and trendlines for ThinkorSwim. Follow this step-by-step thinkorswim tutorial and enjoy! ✅ There will be more Thinkorswim Setup videos coming soon.
thinkScript Link Here:
https://usethinkscript.com/threads/auto-pivot-points-support-resistance-indicator-for-thinkorswim.158/
(0:00): Intro
(1:50): Inside ThinkorSwim
(3:26): The Step-by-Step
(5:54): Examples
(8:46): Outro
Get 2 FREE Webull Stocks (WAYYY better charts than Robinhood 😊📈👍🏾):
https://act.webull.com/kol-us/share.html?hl=en&inviteCode=yFHMTHsdOkTp
Download Tiblio Now & Try Out Winning Credit Spreads. When you sign up using the link below, you will see the “FoxTail Discount” at checkout.
The first month will be $19.95 💥🔥 (Only available to our squad) then it will be the regular $24.95 the following month.
https://tiblio.com/?aff=BSNuWarucuVn5VqoT47Kk7
Click here to download Robinhood and claim your free stock:
https://join.robinhood.com/shaylan12
If you have any suggestions for future videos such as Penny stocks, Swing trading, Options trades or fun vlogs, please let me know.
Thank you for your support, the best way to contact me is via social media.
——————— CONTACT ———————-
Email (Business): foxtailent20@gmail.com
Social Media
Twitter: http://www.twitter.com/team_foxtail
Instagram: http://www.instagram.com/team_foxtail
#stockmarket #blackgirlstocks #robinhood #foxtaildigital #readingstockcharts #beginnertrader #startTradingStocks #Stocks2021 #stockcrash black girl stocks thinkorswim tutorial thinkorswim scanner price action trading support and resistance trading strategy support and resistance thinkorswim


