In this TradeSpoon review we dive deep into their offerings, what we like and dislike and how it compares to other companies.
Brief Overview
Tradespoon is an online security research platform that uses artificial intelligence and machine learning to find trades.
It is the creation of Vlad Karpel, who was in charge of technology at optionsXpress. The software underlying the Tradespoon site has been constantly updated and improved for more than 15 years.
Services Offered
Tradespoon doesn’t offer any actual trading capability. What it does do is to provide a single web-based platform with several analysis tools.
They can be used to predict price movements on a variety of assets, including stocks, ETFs, forex, and bitcoin.
Some of the notable tools include:
- Seasonal charts
- Probability calculator
- Weekly and daily equity, options, and futures predictions
- Educational videos and webinars
- Updated publication of liquid stocks
- Portfolio analysis tools
- Live trading room sessions
- Weekly market commentary
Trade Intelligence Platform
Tradespoon calls its suites of software tools the Trade Intelligence Platform.
Here’s a rundown of the major components:
Seasonal charts
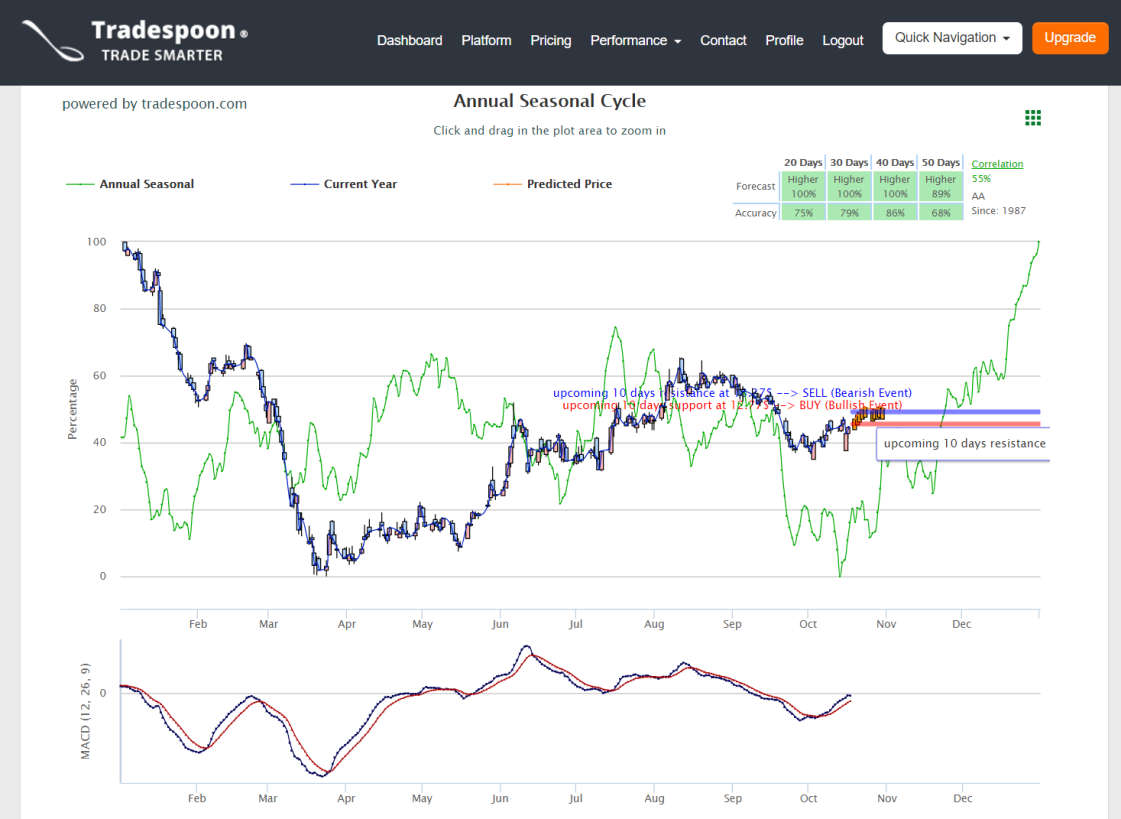
One difference between Tradespoon and a lot of free platforms out there is seasonal charts.
These show price progressions that are averaged over specific time frames. Resistance lines are shown on these graphs along with forecasts and percent probabilities.

What I really like about this charting program is the ability to get quick price forecasts with probability of success.
But YTD is the only timeframe available (you can zoom in, though). And you can’t choose the technical indicators (MACD and Fisher Transform are the two integrated studies).
Tradespoon Bulls and Bears
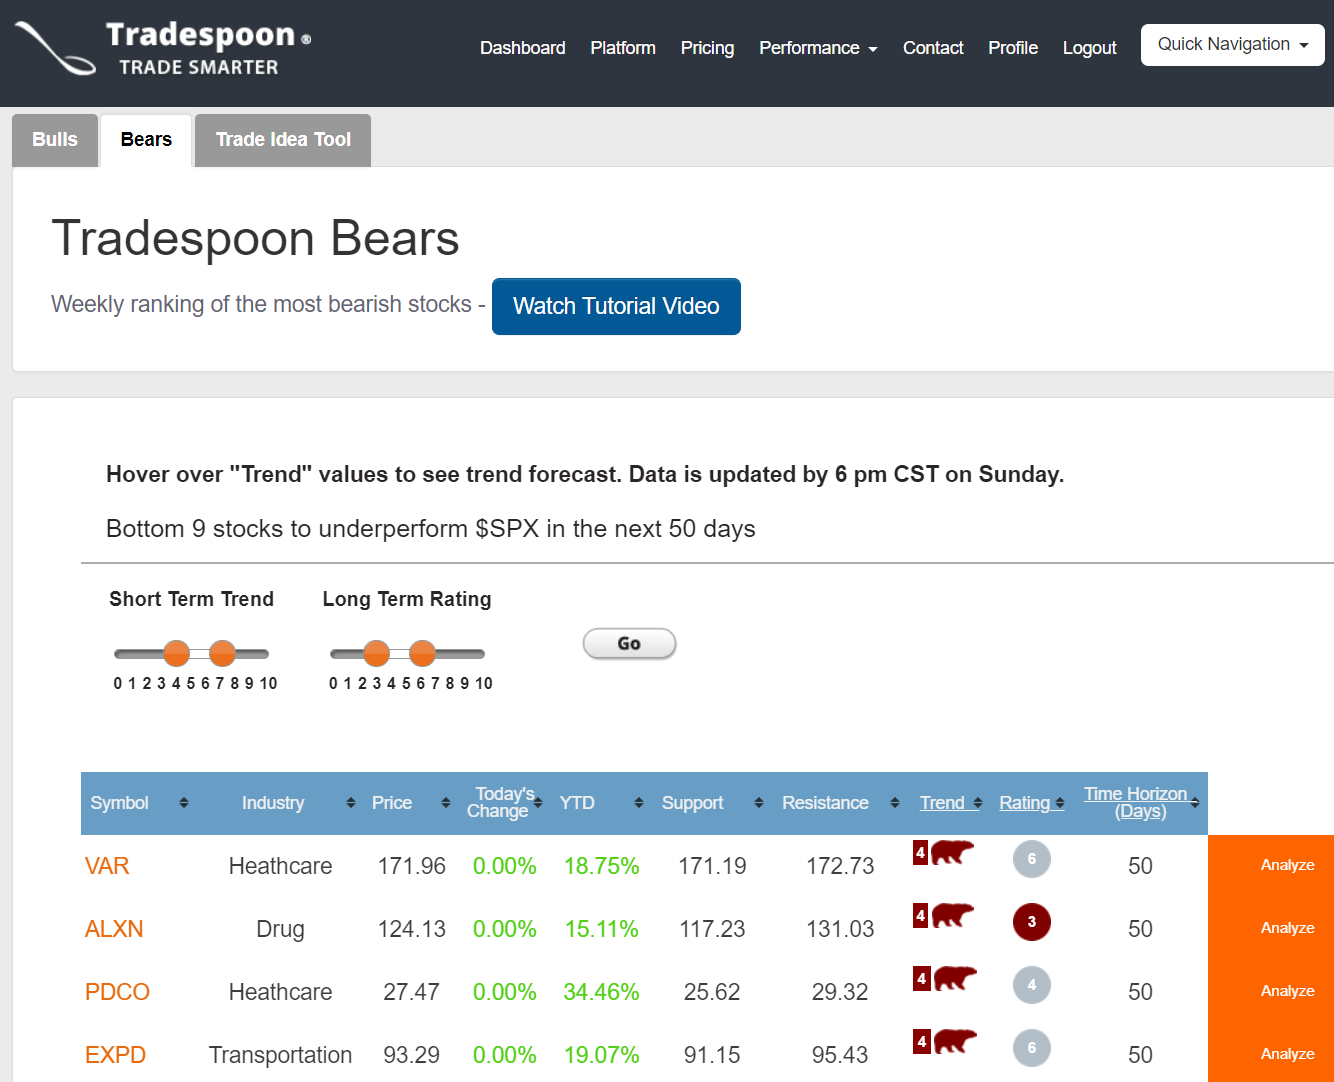
Tradespoon sends out a list every week of the stocks it is most bullish and bearish on. This list is generated by the company’s software after it compares the S&P 500 against these stocks.
The primary time horizon the program uses is 40 to 70 days. It also uses a 10-day timeframe for short-term analysis. Finally, the algorithm comes up with a long-term rating that is good for up to 5 years.
The program also performs back testing. As a final check, human investment professionals validate the digital rankings.

Probability Calculator
Here’s a tool that you can use to analyze the likelihood of an equity trading at a certain price. The probability calculator will give you an estimate of a stock trading below or above a certain level. It can also give an assessment between two price targets.
The timeframe Tradespoon uses is from 20 to 50 days. Price targets are shown for each standard deviation.
Results are displayed with the following highlights:
- Buy/sell rating on a scale of 1 to 10
- Trend, which shows how accurate previous predictions have been
- Support and resistance levels
Active Trader
One of the best ways to learn how to day trade is in a live session with real trades. Tradespoon offers just this. To access the live trading room during a market day, just click on the Quick Navigation menu at the top of the Tradespoon website. Then select Live Trading Room. Previous sessions are saved, and you can always watch these on-demand videos.

Stock Forecast Toolbox
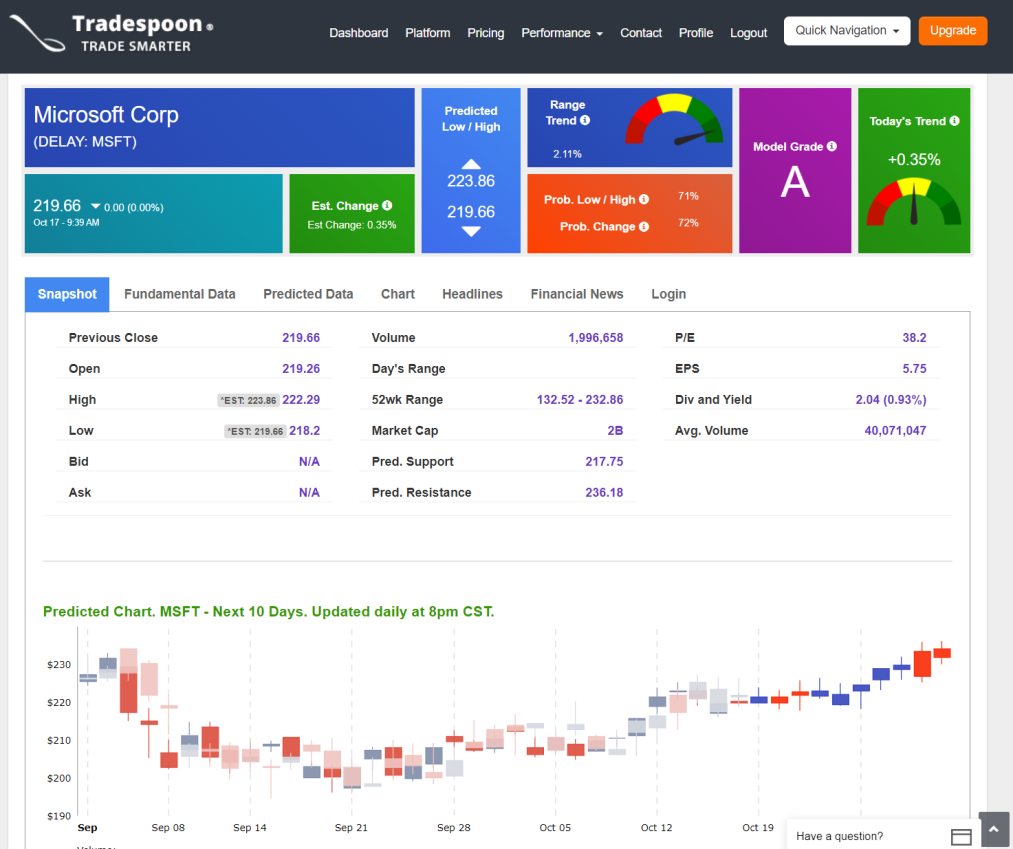
This is a tool that I really like. The stock forecast toolbox is a great place to analyze how an individual stock is performing. There are several numbers Tradespoon’s algorithm delivers.
I especially like:
- Model Grade. This is updated once per week. It shows how accurate the company’s software is at predicting high and low prices. The grading scale is from A to C with A being the highest grade.
- Today’s Trend. This shows the momentum of a stock on the current market day. It compares the security to the previous trading day.
- Range Trend. This metric averages vector values from Today’s Trend to gauge the overall bearish, bullish, or neutral tendency of the stock.
- Probability Change. This number tells you how accurate Tradespoon’s software is at predicting the vector values correctly.
- Predicted Low/High. As the title suggests, this gives a range of what the algorithm is forecasting.
- Probability Low/High. This figure shows you the likelihood of a stock closing between the predicted high and low numbers.
- Next 10 Days. This is a table of predicted OHLC prices with momentum levels over the next 10 days. They are also shown on a chart with trailing prices as well.
- Other Assets. There are tabs for futures, forex, and bitcoin that have some of the same tools. For example, there are price projections for the next 10 days.

Company Screener
If you need some help finding a trade idea, the company screener is a good place to start. It has the following predefined screens:
- Vector screener
- Stocks and ETFs with Model Grade A or B
- Short Term Forecast
- Company Finder
The Model Grade A or B tool presents a list of stocks and ETFs that have that grade. If you would rather search by sector, you should use the company finder. This will lead you step-by-step from sector (such as energy or consumer durables) to just a few stocks.
Active Trader
With the Active Trader tool, you’ll find stock picks for each trading day. The picks are divided into bulls and bears. If you forget how to use the tool, you can simply click on the Tutorial tab. Doing this will generate a pop-up video that explains it.
There are two strategies presented for each stock, each with its own entry, take-profit, and stop-loss points.
- Strategy A. Tradespoon recommends this strategy if S&P 500 futures are down more than 0.5% from the previous day’s close.
- Strategy B. If they’re not down by more than that amount, Tradespoon recommends the alternative strategy.
Besides the strategies, Tradespoon presents a graph for each stock courtesy of TradingView.

Clicking on the graph creates a new tab on TradingView’s site where full-screen charting can be performed. There are lots of graphing tools.
Pricing
You didn’t think all these great services are free, did you? Tradespoon’s monthly subscription plans are a little pricey, but it does offer significant discounts for annual payments. There are three plans available: Stock Forecast, Tools, and Premium.
Stock Forecast costs $127 per month ($697 when billed annually, which boils down to $58 per month). The package comes with Tradespoon’s stock screener, portfolio manager, live strategy roundtable, and profit calculator.
The Tools plan offers everything in the Stock Forecast plan plus the following additions:
- Seasonal charts
- Probability calculator
- Stock Focus List
- Forex and futures forecasting tools
- Portfolio Toolbox
- Tradespoon Bulls/Bears
Tradespoon charges $147 per month for the Tools plan. You can pay $997 for an annual subscription, which saves you about $64 per month.
The most expensive plan is the Premium package. It comes in at $197 per month or $1,497 per annum.
It offers everything the Tools plan does plus these nice highlights:
- Special stock and option recommendations
- Premium text alerts
- Live trading room
- RoboInvestor
- Evening videos
Before you commit to any plan, Tradespoon does offer a free trial.
Customer Support
Tradespoon backs up its product with a customer service page with four basic avenues. The first is a ChatBot tool. This is an artificial intelligence that is supposed to answer questions. During my test drive of it, I couldn’t get it to work.
The next option is a support ticket that allows you to contact the company directly. A third option is a list of FAQs that answers a lot of questions that new customers will have.
The fourth and final route to take is an online consultation tool. With this, it’s possible to schedule an appointment to speak with a Tradespoon representative. Appointments can be scheduled during the weekday.
Bottom Line
Tradespoon offers several nice analysis tools that provide quick price forecasts that day traders can use.
But the company’s prices are awfully steep, especially if you opt for a monthly plan. And only the costliest plan offers the most advanced features, making the service’s value questionable.
The post Tradespoon Review 2020: What We Like and Dislike appeared first on Warrior Trading.


