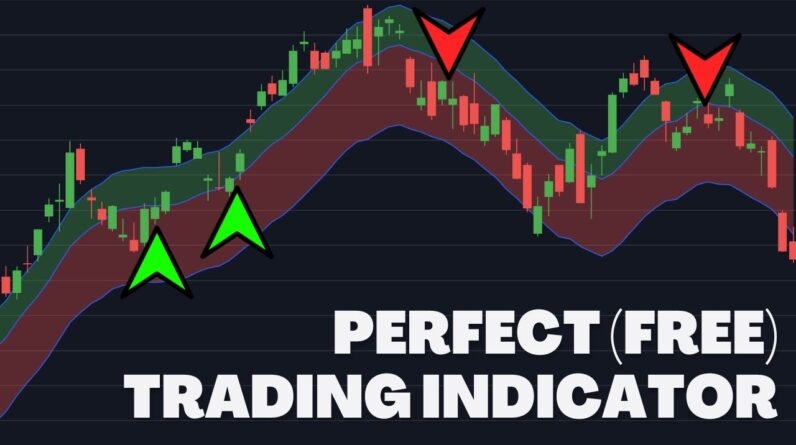
There are dozens, if not hundreds, of different chart patterns that technical chartists use to trade.
Some are simple, like the double top and double bottom.
Some, such as flags and triangles, take longer to learn how to use.
One of the simplest and possibly most effective is the rounding top and rounding bottom.
Let’s look at them in greater detail.
Contents
-
-
-
-
-
- What Are The Rounding Top/Bottom?
- How To Spot A Rounded Top/Bottom
- How To Trade A Rounded Top Or Bottom
- Concluding Thoughts And Extras
-
-
-
-
What Are The Rounding Top/Bottom?
The rounding top and bottom are chart formations that indicate a reversal in an asset price.
When a rounded bottom or top is being put in, the chart will start to gradually for a nice rounded “U” shape for a bottom and an inverted “U” share for a rounded top.
These patterns can often be matched to volume to look for accumulation or distribution, depending on whether it is a bottom or a top.
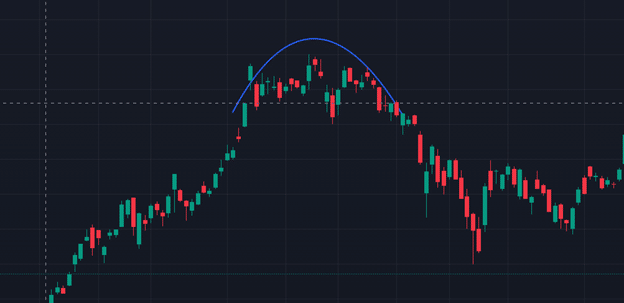
Once the pattern is completed, it should look similar to the top below in Tesla from 2021.
How To Spot A Rounded Top/Bottom
Now that we know what the rounded top and rounded bottom look like, let’s explore how to spot them so that we can trade them effectively.
The first step is to identify the prevailing trend.
In the chart above, Tesla has been in an uptrend for several weeks.
The rounded top started to form when the price slowly started to oscillate between up days and down days without gaining much ground in either direction.
Volume could also show that momentum had started to stall (not pictured above).
Finally, the price started to move against the previous trend, showing that sellers were stepping up and completing the roundtop.
All of the same traits would apply to a rounded bottom, but we would be looking at it from the perspective of coming out of a downtrend.
How To Trade A Rounded Top Or Bottom
How to trade the rounded top and bottom depends on your main trading style.
There are many ways to trade it, but two are more common.
Below, we will go over these two methods.
The Breakout Trade
This is by far the most common way to trade these chart patterns. This trade is entered when the price moves above or below the resistance or support line.
This part of this chart pattern is a little tricky as it requires some practice.
But the resistance/support is usually the bottom ⅓ of the rounded bottom and the top ⅓ for a rounded top.
The below example in Exxon shows what this might look like.
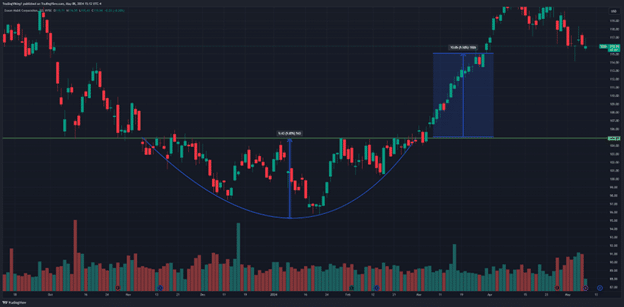
This level, denoted by the green horizontal line, might look arbitrarily selected, but it is not.
There were several attempts to close above it during the bottom formation, and this is a tip-off that you are around a resistance level.
That would be the breakout point for your entry.Next, you would calculate how deep the bottom/top moves from the breakout line.
This is now called a measured move and is used by many traders to determine the number of points to use as a take profit.
In the image, the measured move is represented by two blue lines: the thin one to show how deep the price fell and the fatter one to show where a take profit could be.
You would put your stop loss under the bottom of the low of the move.
One way to amplify the profits of this trade would be to use options.
Naked put or call options would be the most profitable but can be the most difficult as well because if you mistimed the trade, you would have theta working against you faster than the price working for you.
A better choice would be a credit or debit spread.
The fact that a contract is both bought and sold will help keep a trade from getting completely destroyed with theta burn if it takes a while for the price to hit the profit target.
Credit spreads will pay you upfront but often give you less profit potential.
A debit spread will give you a great potential profit, but you still need to pay for this spread, which is similar to a long call or put.
The Early Trade
The early trade is the same as above but, as the name implies, just started earlier.
This has the potential to be a better trade profit-wise as you are trying to time the bottom (or top) of the move a little better than with the breakout.
One of the stronger ways to play the early trade is to wait for a lower low to develop but to watch for a strong reaction off that low.
An example of this can be seen in the chart below.
The purple rectangle shows what a rejection might look like.
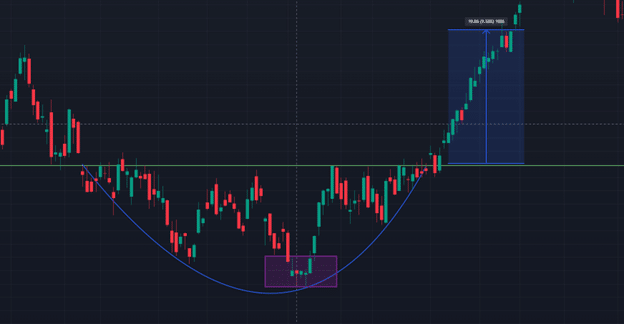
The early trade would start to get entered on that first candle outside of the rectangle.
This would be where you would start to layer or scale into a trade, with the entire position ideally full when the breakout occurs over that green line.
The target price on this trade would still be the measured move we discussed above, and a stop loss would still be under the bottom of that low; however, your average cost will be lower than if you fully entered a position on the breakout, helping to decrease your risk and increase your potential return.
Using options can increase your return as well here.
Similar to above, a credit or debit spread will always be a safer way to play the trade, but a ratio spread or even a longer-dated call or put could always be a very powerful way to trade the early trade.
Similar to equities, if possible, you would want to scale into a position to help average out your cost for a move.
This can help keep theta burn manageable until the breakout happens.
At this point, the long option would help increase profit potential.
Concluding Thoughts And Extras
The rounded top and bottom are great chart patterns in and of themselves.
They are extremely common and easy to spot once you practice looking for them.
Another point is that they can occasionally double back after a breakout, forming a small retracement.
When this happens, it can become what’s known as a cup and handle formation.
The trade is still valid, but the “handle” low can now be a stop-loss location.
The target price is still the same with the measured move of the rounded bottom/top.
Whether you are waiting for the breakout or trying to get in early, the rounded bottom has a trade for everyone.
Buying and selling the equities are a tried and true method for trading these patterns, but utilizing options can help to leverage up your returns while cutting down your risk of loss.
We hope you enjoyed this article on rounding top and rounding bottom patterns.
If you have any questions, please send an email or leave a comment below.
Trade safe!
Disclaimer: The information above is for educational purposes only and should not be treated as investment advice. The strategy presented would not be suitable for investors who are not familiar with exchange traded options. Any readers interested in this strategy should do their own research and seek advice from a licensed financial adviser.

Original source: https://optionstradingiq.com/rounding-top-and-rounding-bottom-patterns/


