The whole world remembered what happened on Tuesday, September 11th, 2001, when 2,977 people died in the history’s deadliest terrorist attack.
An American Airlines Flight 11 plane hijacked by terrorists intentionally crashed into the North Tower of the World Trade Center building (somewhere between the 93rd to 99th floors) at 8:46 AM Eastern Standard Time.
A second hijacked plane (United Airlines 175) crashed into the South Tower of the World Trade Center building between floors 77 and 85 at 9:03 AM Eastern Standard Time.
Contents
-
-
-
-
-
- What Happened in the Markets on September 11th, 2024
- Frequently Asked Questions?
-
-
-
-
The World Trade Center and the New York Stock Exchange are in New York.
The events occurred before the stock market’s usual open time at 9:30 AM Eastern Standard Time.
Subsequently, the New York Stock Exchange and the Nasdaq did not open for normal trading that Tuesday.
And they remained closed for the remainder of that week.
The markets opened again the following Monday.
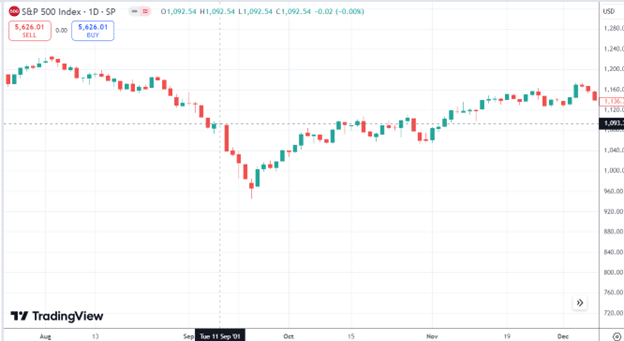
That week, when the market reopened, we saw the SPX (S&P 500 index) drop from 1090.23 to 965.80, an 11.4% drop.
But the SPX index recovered that loss and was back to its pre-attack levels three weeks later.

Source: TradingView
What Happened in the Markets on September 11th, 2024
September 11th, 2024, was not as tragic as that date twenty-three years ago.
Nevertheless, there was some interesting intraday market action.
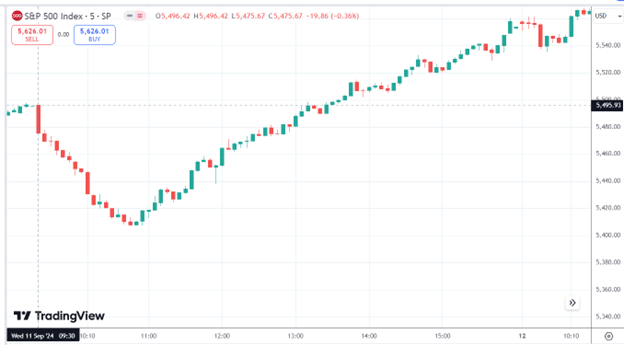
Here is a 5-minute chart of the SPX on September 11th, 2024…

The SPX opened at 5496.42 and dropped to 5406.96 – a 1.6% drop.
An 89-point drop like that would be considered a large move.
Then it did a full-reversal closing above, where it started by over 57 points or 1%.
It closed at 5554.14.
This is what traders call a “whipsaw” day.
The ATR (Average True Range) for that day was 80.
On that day, SPX went down 89 points, and then it went back up that 89 points to where it started.
Then, it continued up to another 57 points.
From bottom to top, it traveled 147 points in 5 hours.
The SPX is moving at an average rate of 29 points per hour. It was moving fast.
Frequently Asked Questions?
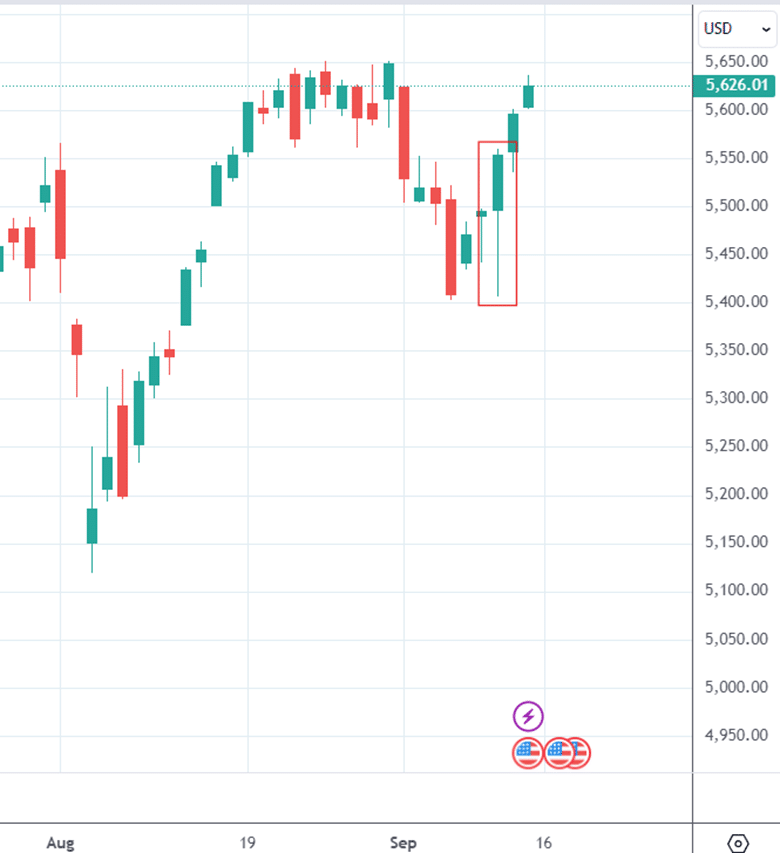
What Does the Daily Candlestick Look Like on a Whipsaw Day?
It looks like this one that is highlighted (which is September 11th, 2024).:

This candlestick is not a “pin bar” because a pin bar has a small body.
This is a full-bodied up-day candle with a bottom wick, a very bullish candlestick pattern.
And the market did move higher the following two days.
How Rare Are Whipsaws Like That?
This candlestick shape is not particularly rare.
However, the magnitude of the whipsaw where SPX went down more than 1% and then closed up over 1% is a bit rare.
From the period starting in 1991 to September 11th, 2024, this whipsaw occurrence of that magnitude happens about 3% of the time.
The greater the magnitude of the whipsaw, the more rare they are.
So a whipsaw of 2% down and then closing 2% up would be even rarer.
Whipsaws of the opposite direction are rare. In other words, a market initially going up 1% and then closing down 1% would be rarer than if it initially went down 1% and then closed up 1%.
As an interesting side note, whipsaws are more frequent when VIX is higher (say above 25).
However, on that day, VIX was not above 25. It was just slightly below 20.
How Rare Are Market Closures?
If you mean how rare it is for the markets to be closed for the rest of the week after the terrorist attack, it is rare.
Extended market closures of such nature have occurred only twice in history.
One time during World War I and another time during the Great Depression.
Other than September 11th, it had not happened within our lifetime so far – unless you are over 110 years of age to have seen World War I or over 95 years to have seen the Great Depression.
Are These Facts Accurate?
I understand that some nitty gritty details in this article contain obscure statistics. Only here can you get details such as the velocity of SPX moving at a rate of 29 points per hour
They are believed to be accurate at the time of the writing.
Being human lends the possibility of errors. In addition, the sources from which these facts are obtained could also be inaccurate (as humans compile them).
Where Are The Sources From Which Some Of These Facts Are Obtained?
Of course, from Wikipedia, such as here and here.
The second link may contain images some viewers would rather not be reminded of.
As to the statistics on the occurrence of whipsaws, we have to thank the research team at Tastylive and thank them for publishing it on YouTube.
The statistics that they did were on SPY. However, since SPY is the ETF of the SPX and the two are highly correlated, it is reasonable to assume that it also applies to SPX.
We hope you enjoyed this article on what happened in the market on September 11th, 2001, and 2024.
If you have any questions, please send an email or leave a comment below.
Trade safe!
Disclaimer: The information above is for educational purposes only and should not be treated as investment advice. The strategy presented would not be suitable for investors who are not familiar with exchange traded options. Any readers interested in this strategy should do their own research and seek advice from a licensed financial adviser.

Original source: https://optionstradingiq.com/what-happened-in-the-market-on-september-11th-2001/


