


The shape of the Treasury yield curve helps us understand the health of the economy and identify potential warning signs of a recession.
Some people say that an inverted yield curve shape foreshadows a recession.
Is that true?
Before we answer that important question, let’s understand what the yield curve is.
Contents
- What Is The Treasury Yield Curve?
- Where Can We See The Treasury Yield Rates?
- How Can We See The Shape Of The Yield Curve?
- What Is Yield Curve Inversion?
- Why Are The 10-Year And 2-Year Yields Important To Watch?
- Where Can We See A Graph Of The 10-Year And 2-Year Yield Spread?
- Does A Yield Curve Inversion Predict A Recession?
- FAQ
- Summary
What Is The Treasury Yield Curve?
The U.S. government borrows money by issuing Treasury securities with different maturities, ranging from a few weeks to 30 years.
Each Treasury security has an interest rate, or yield, which can fluctuate from day to day.
Where Can We See The Treasury Yield Rates?
The most direct source is from the US Department of the Treasury government site.
We can see the rates for the different maturities in table form on a daily basis.
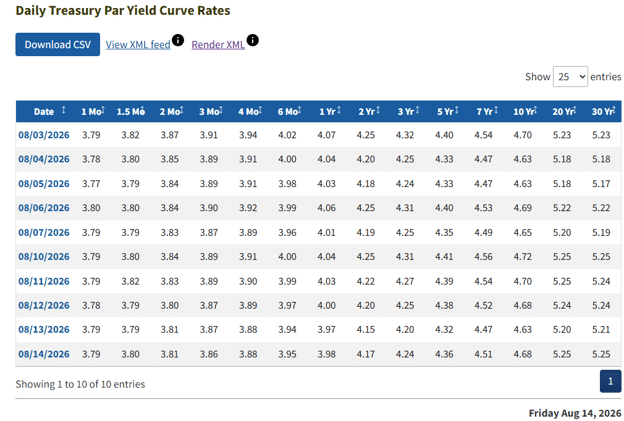
As of August 14, 2026, we see that the 2-year maturity Treasury has an annual interest rate of 4.17%.
The 10-year maturity Treasury has an interest rate, or yield, of 4.68%.
Under normal market conditions, longer-term Treasuries have higher yields than shorter-term Treasuries, which is the case here.
Since the lender’s money is being tied up for a longer maturity, it makes sense that the 10-year Treasury has a larger yield than the 2-year Treasury.
How Can We See The Shape Of The Yield Curve?
To see the shape of the yield curve, you can take one row of the data, paste it into a spreadsheet and plot it.
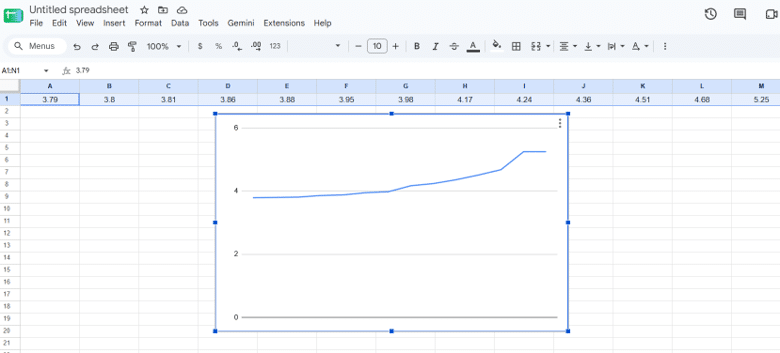
This is very rudimentary and cumbersome.
An easier way is to go to ustreasuryyieldcurve.com
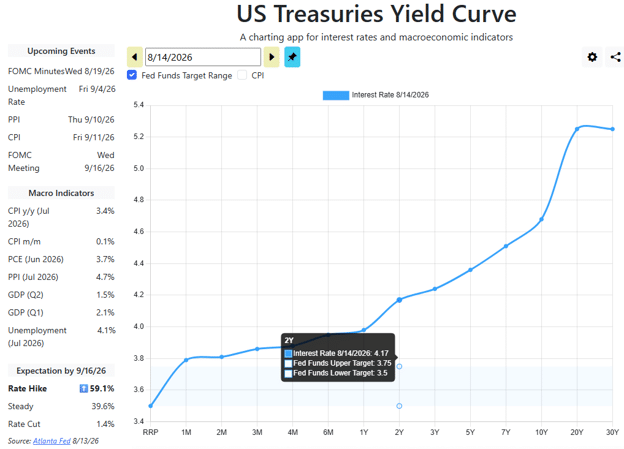
This is not a government site, but is created by Winston Kotzan and privately owned by WP Finance LLC.
It gets its data from the same source and we can see that the numbers match.
Longer maturities with higher rates produce an upward-sloping yield curve, which is considered the normal configuration.
Normally, investors expect to receive a higher yield for committing their money for a longer period.
There is more uncertainty over 10 or 30 years than over a few months, so investors generally demand additional compensation for taking that longer-term risk.
What Is Yield Curve Inversion?
But sometimes the relationship changes.
Short-term Treasury yields can rise above long-term yields.
When that happens, the yield curve becomes inverted.
And that is when economists and investors start paying close attention, and that is what people are looking for in the shape of the yield curve.
Why Are The 10-Year And 2-Year Yields Important To Watch?
The 10-year minus 2-year Treasury spread is probably the most widely followed measure of yield-curve inversion.
In our example, the 10-year yield minus the 2-year yield is
4.68 – 4.17 = 0.51
When this number is positive, we have a normal yield curve.
If that number is negative, we have an inverted yield curve.
Where Can We See A Graph Of The 10-Year And 2-Year Yield Spread?
You can see a plot of the spread at the Federal Reserve Economic Data (FRED) site operated by the Federal Reserve Bank of St. Louis.
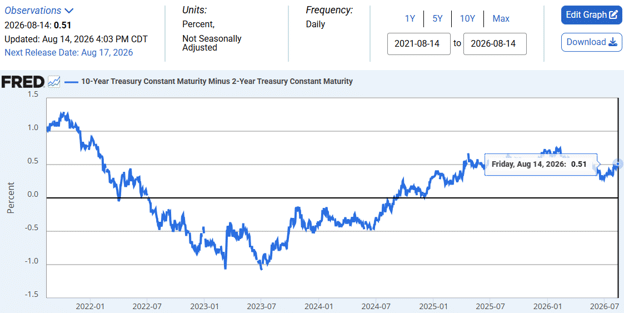
We see that it is giving a 10-year minus 2-year spread of 0.51 – exactly as calculated.
Other Yield Curve Measures Worth Watching
The 10Y-2Y spread is the most widely cited, but it is not the only yield curve measure that economists and traders monitor.
The 10Y-3M spread (10-year minus 3-month Treasury yield) is actually preferred by some Federal Reserve researchers as a more reliable recession predictor.
The New York Fed publishes a monthly probability model based on this spread.
When the 3-month yield rises above the 10-year, as it did dramatically in 2022–2023, the model assigns a higher probability to a recession in the following 12 months.
The 3-month yield is more directly influenced by Federal Reserve policy than the 2-year yield, which makes it a purer measure of the Fed’s stance relative to long-term market expectations.
The 30Y-5Y spread and 30Y-10Y spread are watched by bond traders to gauge longer-term inflation and growth expectations.
These are less commonly cited in the context of recession prediction but can provide useful context about the steepness of the long end of the curve.
For most equity and options traders, the 10Y-2Y spread on FRED is sufficient.
It’s updated daily and provides the historical context needed to assess current conditions.
Does A Yield Curve Inversion Predict A Recession?
No.
And the above example was a clear example of this.
The yield curve was inverted from mid-2022 thru till mid-2024.
Yet, there was no official recession during that period or in the subsequent period.
It was a false positive.
A recession is officially determined by the National Bureau of Economic Research (NBER), which defines a recession as a significant decline in economic activity that is widespread across the economy and lasts more than a few months.
While not the official definition, the commonly cited rule of thumb is two consecutive quarters of negative GDP growth.
An inverted yield curve is a warning that economic conditions may deteriorate in the future, not a prediction that a recession is imminent.
Expanding the graph to its max data and turning on recession shading in gray…
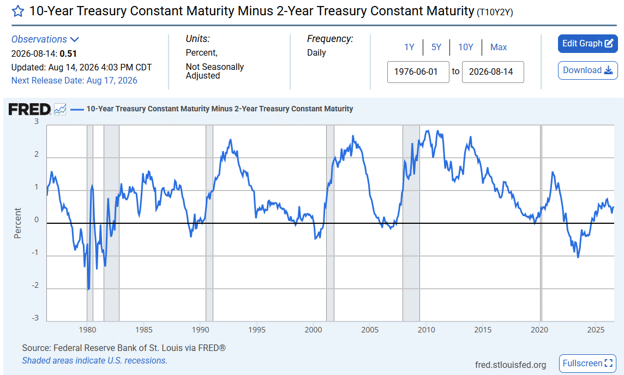
We see that even in cases where a recession followed, it often comes after a significant time lag.
And sometimes the curve can normalize before or around the time the economy actually weakens.
Even in cases where a recession did follow a yield curve inversion, the lag between the inversion and the onset of recession has historically ranged from 6 to 24 months.
This makes the inversion a poor timing tool for traders.
If you had sold equities or moved to cash every time the yield curve inverted, you would have missed significant market gains during the inversion period itself.
The S&P 500 rose substantially during the 2022–2024 inversion, demonstrating that equity markets can and do perform well even when the yield curve is inverted.
The practical interpretation: a yield curve inversion is a yellow flag that warrants attention, not a red flag that demands immediate action.
It may signal that economic conditions are becoming more fragile, but it gives no useful guidance on timing.
What the Yield Curve Means for Options Traders
Interest rates and the yield curve don’t affect options traders as directly as they affect bond traders, but there are three specific connections worth understanding.
Rho and interest rate sensitivity.
Options have a Greek called rho that measures sensitivity to changes in interest rates.
When short-term rates rise, as they did during the 2022–2023 inversion period, call options become slightly more valuable and put options become slightly less valuable, all else being equal.
For most short-dated options (30–60 DTE), rho is small enough to ignore.
For longer-dated options (LEAPS, or the long-term put selling strategy covered in our selling long-term puts guide), rho becomes more meaningful.
Elevated rates benefit cash-secured put strategies.
When short-term rates are high, the cash held as collateral for cash-secured puts earns meaningful interest.
This adds a secondary income stream to strategies like the wheel and cash-secured puts, as discussed in our selling long-term puts for income article.
This interest income disappears when rates normalise lower.
Macro uncertainty increases implied volatility.
When the yield curve inverts and recession fears rise, implied volatility tends to increase across equity markets.
This benefits options sellers running iron condors, bull put spreads, and other premium-selling strategies — richer premiums mean more income for the same risk.
The 2022–2023 period of elevated VIX that accompanied the yield curve inversion was actually a productive environment for premium sellers who managed their risk correctly.
The key takeaway: a yield curve inversion is not a reason to stop trading.
It’s a reason to be aware of the macro backdrop, potentially favour strategies that benefit from elevated volatility, and maintain appropriate position sizing and risk management.
FAQ
What Does An Inverted Yield Curve Mean In Simple Terms?
Normally, longer-term bonds pay higher interest than shorter-term bonds.
Investors are compensated for tying up money longer.
An inverted yield curve means this relationship has flipped: short-term bonds are paying more than long-term bonds.
This typically happens when the Federal Reserve has raised short-term rates aggressively (to fight inflation) while long-term rates reflect expectations that growth and inflation will slow.
It signals that bond markets expect economic conditions to change, but not necessarily that a recession is imminent.
What Is The Current Yield Curve Shape?
As of August 14, 2026, the 10-year minus 2-year spread is +0.51%, indicating a normal upward-sloping yield curve.
The curve normalised from its extended inversion in mid-2024 after the Federal Reserve began its rate-cutting cycle.
For the current reading, visit FRED directly.
How Many Times Has The Yield Curve Inverted And Not Led To A Recession?
The 2022–2024 inversion is the most prominent recent false positive.
Historically, most significant inversions have eventually been followed by recessions, but the timing lag has been so variable (6–24 months) and the false positive rate high enough that the signal is widely considered unreliable as a timing tool.
The historical data is available with recession shading on FRED, and readers are encouraged to examine it directly rather than rely on simplified interpretations.
Should I Change My Investment Strategy When The Yield Curve Inverts?
Not based on the inversion alone.
The inversion is a warning indicator with a poor timing record.
Acting on it aggressively has historically meant missing significant market gains during the inversion period itself.
A more measured approach is to note the macro signal, maintain appropriate risk management and position sizing, and avoid making large binary bets based on a single indicator.
Professional economists disagree significantly on the predictive value of the yield curve, which itself is a useful data point.
What Is The Difference Between The 10Y-2Y And 10Y-3M Spread?
Both measure yield curve inversion but from slightly different angles.
The 10Y-2Y spread uses the 2-year Treasury yield, which is influenced by both Fed policy expectations and medium-term growth expectations.
The 10Y-3M spread uses the 3-month Treasury yield, which is more directly controlled by current Fed policy.
Some Federal Reserve researchers consider the 10Y-3M spread a more reliable recession predictor because it more cleanly captures the tension between current policy and long-term growth expectations.
Both are available on FRED.
Summary
The Treasury yield curve is essentially a picture of interest rates across different borrowing periods for the U.S. government.
Under normal circumstances, longer-term Treasury yields tend to be higher than short-term yields.
When short-term yields rise above long-term yields, the curve becomes inverted.
An inverted yield curve should not be interpreted as a signal of an imminent stock-market crash or a pending recession.
Rather, it is a warning that investors expect economic conditions and/or interest rates to change in the future.
While there is some merit to the yield-curve inversion as an economic warning indicator, its track record is far from perfect and it can give false positives.
Readers are encouraged to examine the historical data using the resources provided and draw their own conclusions about how reliable the yield-curve inversion signal really is.
Want to Generate Income Regardless of the Macro Environment?
Yield curves, recession fears, and macro uncertainty come and go — but a systematic options income approach generates consistent returns across different environments.
Options Income Mastery covers how to adapt your strategy to different market conditions, including how to use elevated volatility periods like yield curve inversions to your advantage.
Learn more about Options Income Mastery →
We hope you enjoyed this article on the Treasury yield curve inversion and recession prediction.
If you have any questions, please send an email or leave a comment below.
Trade safe!
Disclaimer: The information above is for educational purposes only and should not be treated as investment advice. The strategy presented would not be suitable for investors who are not familiar with exchange traded options. Any readers interested in this strategy should do their own research and seek advice from a licensed financial adviser.
Original source: https://optionstradingiq.com/treasury-yield-curve-inversion-recession/