Today we will focus our attention on adjusting calendar spreads and how to manage them.
Contents
-
-
-
-
-
- Put calendar example
- Method #1: Roll short strike vertically
- Timed exit
- Method #2: Roll out in time
- If Price Crashes
- Conclusion
-
-
-
-
In this article, we will learn how to adjust and manage calendar spreads so that we can stay in the trade long enough to get some profits.
Investors employ the calendar options strategy in a low implied volatility environment in which they believe the price will stay within a range.
Since prices don’t stay in a range for a long time, the goal is to stay in the calendar as long as possible without the price going against us.
Put Calendar Example
Suppose an investor initiates a put calendar spread on Tesla (TSLA):
Date: June 10, 2021
Price: TSLA @ $610.12
Sell one $610 TSLA Jul 16 put @ $39.43
Buy one $610 TSLA Aug 20 put @ $59.18
Debit: $1975
The payoff diagram shows an estimated max profit of around $2000.
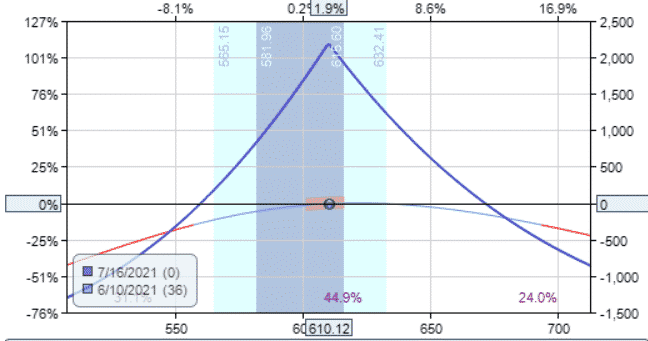
The max risk is $1975, the amount paid for the spread.
This makes sense because the short option obligates the investor to purchase TSLA at $610 if the price is below $610 at short option expiration.
However, due to the long option, the investor can sell TSLA back at $610 any time before August 20.
Hence there is no loss on the stock.
The only loss is the cost paid by the investor to create the calendar.
Keep in mind that the max loss can change when one makes adjustments.
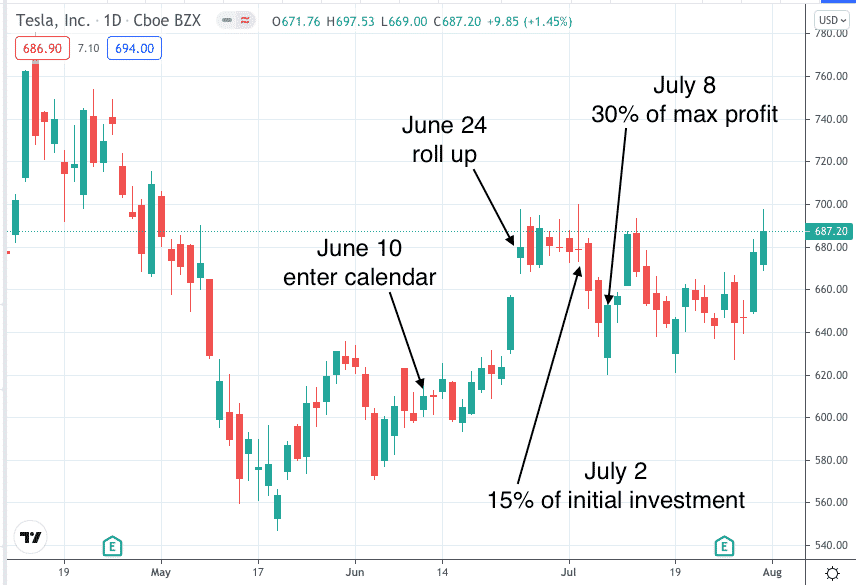
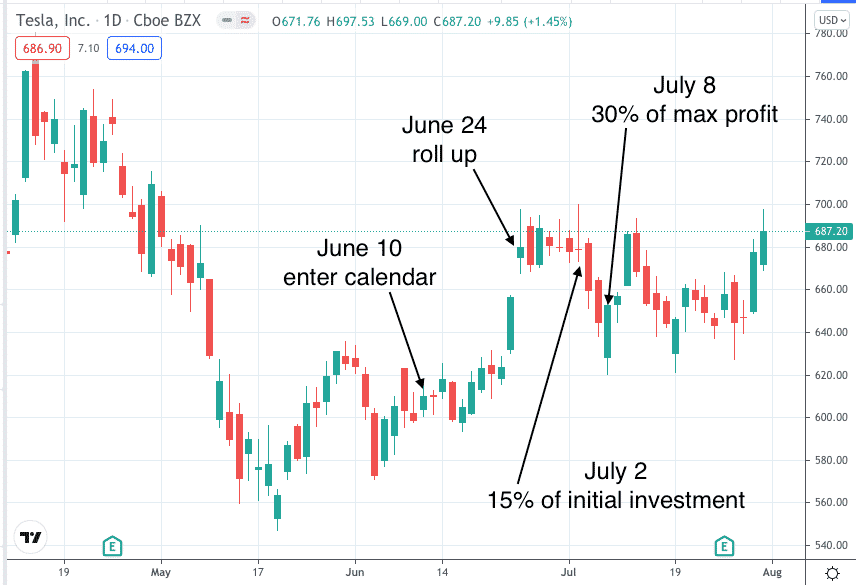
On June 24, the price of TSLA rallied up to the expiration breakeven.
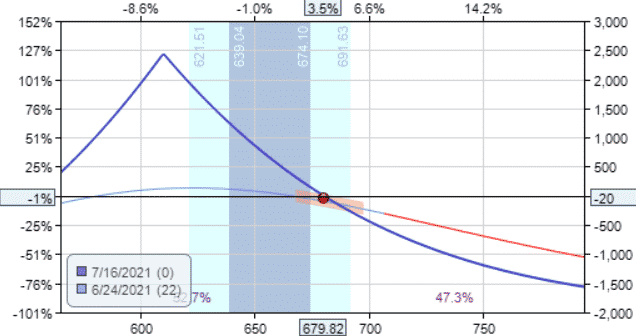
An investor who doesn’t know how to adjust calendars or chooses not to exit at this point — will end up not making money or losing a significant amount of money.
Best of Options Trading IQ
Method #1: Roll Short Strike Vertically
Fortunately, we are options investors who know how to make adjustments, so instead of exiting the position, we roll the short option up to the $645 strike (which happens to be out-of-the-money at 32 delta)
Date: June 24
Price: $679.82
Buy to close one $610 TSLA July 16 put @ $11.40 and
sell to open one $645 TSLA July 16 put @ $20.00
Credit: $860
We are not saying to always roll to the 30 delta. It depends.
What you want to have is that the post-adjusted payoff diagram looks like this.
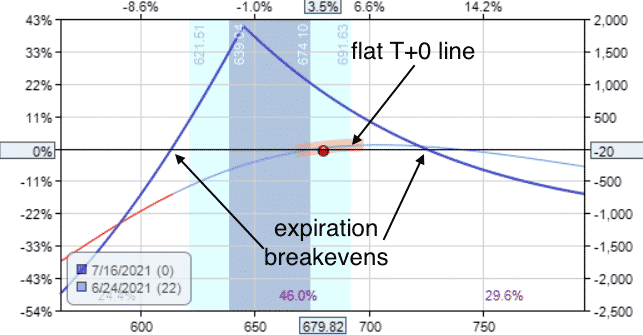
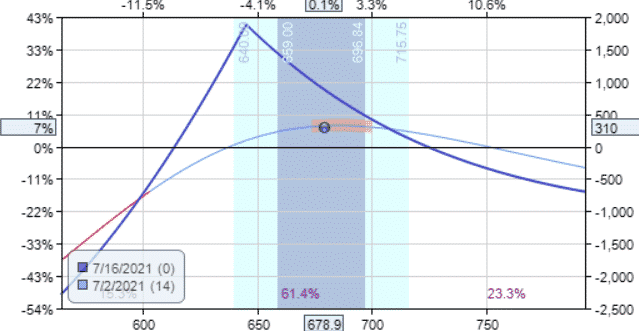
The T+0 line is relatively flat.
And there is room for the stock to move up and down before hitting the breakeven points.
The previously symmetrical calendar has morphed into a diagonal spread.
We removed some of the risks from the upside and transferred the risk to the downside.
If the stock price goes all the way down, the max loss is now greater than our initial max loss of $1975.
If the price goes all the way up, the max loss is much lower than the original $1975.
The stock price went up, so we made the adjustment so that we did not get hurt if the price continues to go up.
We see this in the risk graph, and looking at the Greeks:
Prior to adjustment: Delta: -7.23 Theta: 18.10 Vega: 42.63
After adjustment: Delta: 4.06 Theta: 26.27 Vega: 30.77
We see that delta went from a negative -7.23 (which means we benefit if the stock goes down) to a positive 4.06 (which means we benefit if the stock goes up).
The magnitude of delta decreased from a 7 to a 4, which means that our P&L (profit and loss) will not be as sensitive to price movements.
Furthermore, we see that the time decay theta has become more positive.
Positive theta means that we benefit from the passage of time, with all other things being equal.
The more positive theta is, the better. We don’t want to see negative theta.
The adjustment increased theta from 18 to 26.
And finally, we received a credit for the adjustment.
The adjustment we made is excellent in every way.
As long as the price of Tesla stays within the “tent”, we continue with the trade until it reaches the profit target.
If the stock price reaches expiration breakeven points again, we will need to exit the trade or adjust again.
Each investor will have different profit targets.
A conservative profit target is a profit of 15% of the initial debit paid.
In this case, the 15% profit target would have been achieved on July 2 with a profit of $296.
A more aggressive profit target might be 30% of the max potential profit (the peak on the expiration curve is at $2000).
In this case, that target would have been achieved later on July 8 with a profit of $600.
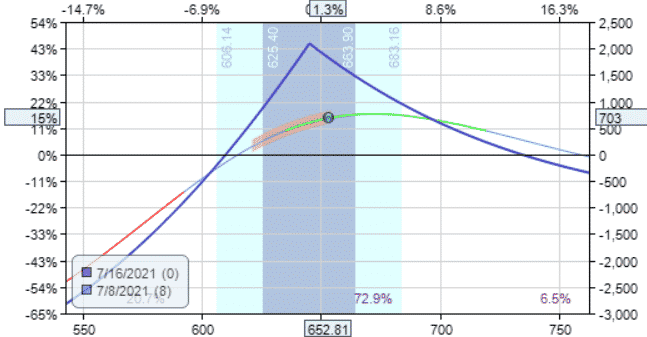
July 8 is coming close to the short option expiration of July 16.
Some investors who like to limit the risk of the assignment will want to exit one or two weeks prior to expiration, that taking whatever gains or losses at the time.
Timed Exit
When the calendar is constructed, as in this example, exiting one or two weeks prior to the short strike expiration happens to be about 30% to 40% of the duration to the long strike expiration.
While there is no one optimal time to exit, this is quite a favorable time to exit. Why?
Assume that no adjustments are made.
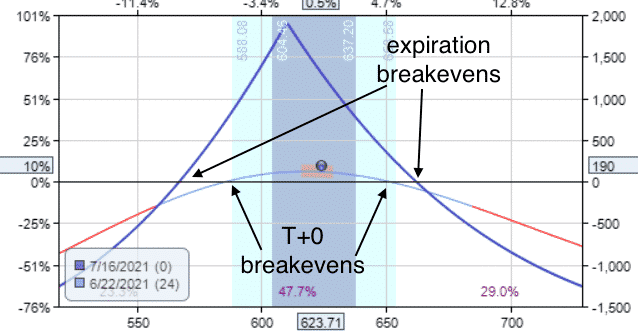
Looking at the original payoff diagram, this is how the T+0 line looks like early in the trade.
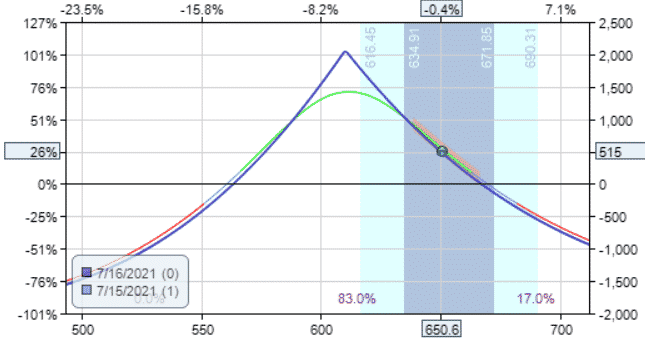
And this is what the payoff diagram looks like one day prior to the expiration of the short strike.
This is the payoff diagram on July 9, one week prior to the short strike expiration.
It is also 29 calendar days into the trade or 40% of the duration of the long option expiration with 71 DTE (days-to-expiration).
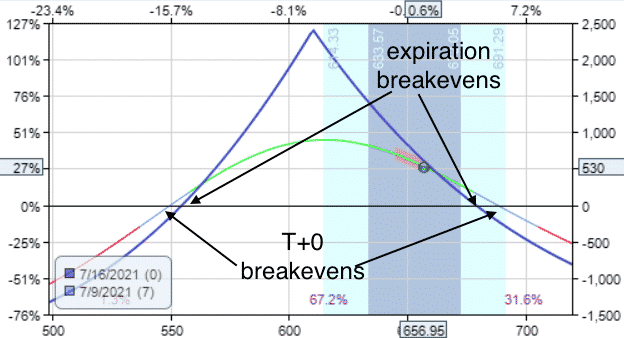
The T+0 breakeven here is wider than the expiration breakeven.
At the beginning of the trade and for most of the trade, the T+0 breakevens are narrower than the expiration breakevens.
Just before expiration, the T+0 breakevens will match the expiration breakevens.
We are speaking roughly here.
Every calendar construction is slightly different.
You can simulate the passage of time in your trading platform and determine where the widest T+0 breakevens are, and mark in your trade plan to exit at that point if the profit target hasn’t been reached.
Method #2: Roll Out In Time
I must admit, I play favoritism to put calendars (explanation later).
But let’s give the call calendar some love too. Same trade but with calls.
Date: June 10, 2021
Price: TSLA @ $610.12
Buy one $610 TSLA Aug 20 call @ $59.48
Sell one $610 TSLA July 16 call @ $39.45
Debit: $2002.50
On June 24, when the price hit expiration breakeven, we could make the same adjustment by moving the short call up.
But wait. Before you click the “submit order” button, check if you are collecting a credit or making a debit.
In this case, we would have to pay a debit to roll up the short strike to accommodate the price movement.
While sometimes it may be necessary, you have to ask if it is worth spending money to repair a trade.
An alternative way is to roll the short leg out in time for a credit as follows.
Date: June 24
Price: $679.82
Buy to close one $610 TSLA Jul 16 call @ $81.48
Sell to open one $610 TSLA Jul 23 call @ $87.45
Credit: $597.50
Note that we kept the strike price the same.
After the adjustment, we can see on the payoff diagram that it did not give us that much room to the upside breakeven.
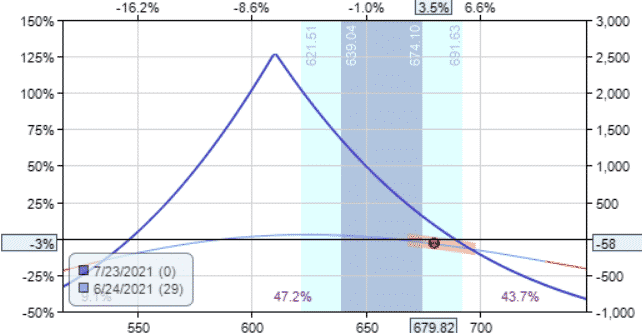
The Greek showed that we decreased the magnitude of delta slightly but did not give us any better theta.
Prior to adjustment: Delta: -7.23 Theta: 18.10 Vega: 42.63
After adjustment: Delta: -4.14 Theta: 16.45 Vega: 31.07
The advantage of this adjustment is that it reduces the max risk of the trade by exactly the credit that we received for the adjustment.
Now the max risk on either side is $2002.50 – $597.50 = $1405.
Only July 7, we achieved 15% profit on the initial investment.
The investor can close the trade by selling the long and buying back the short for a net credit of $1767.50.
Summing up the credits and debits, we get a profit of $362.50
–$2002.50 + $597.50 + 1767.50 = $362.50
There are still 16 days left till the new July 23 expiration of the short option.
If the investor were to continue with the trade, it would be a bit of a gamble.
But in this case, it paid off.
Because on July 16, one week before the expiration of the short option, the profit target of $600 was achieved.
That is 30% of the initial maximum potential profit or almost one-third of the way up the tent.
If Price Crashes
The previous example was a winner because although the price got outside the tent, the price eventually came back towards the original calendar center.
Let’s stress-test the calendar by putting them through a trade where prices do not return.
We’ll do 45 Cisco (CSCO) contracts to make the trade comparable to the TSLA trade.
One problem with calendars on lower price stocks is that you have to do many contracts to make any significant gains.
A large number of contracts will become a problem if you get assigned.
Date: Jul 15, 2020
Price: CSCO at $46.40
Sell 45 contracts Aug 21 CSCO $46 put @ $1.81
Buy 45 contracts Sep 18 CSCO $46 put @ $2.25
Debit: 45 x $44.5 = $2002.50
The initial max risk is similar to the Telsa example.
However, the payoff diagram shows that the estimated max profit of $5000 is more than twice as much as Telsa.
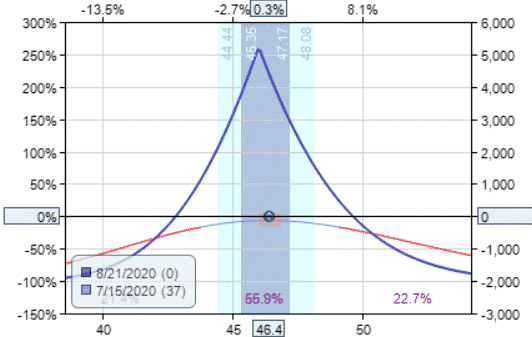
The CSCO has a higher reward-to-risk ratio. Why?
For TSLA, the long option price that we are buying at is 50% higher in cost than the short option.
For CSCO with similar construction (short expiration one month away and long and short legs one month apart), we are buying at the long option price is only 25% higher than the short option price.
In CSCO, the lower cost of the long option to the price of the short option gives us this higher reward-to-risk ratio.
This is due to the skew differences in implied volatility between the two months.
It is advantageous to initiate calendars where the front-month option has higher implied volatility than the back-month option.
In this case, CSCO’s front-month option has an IV (implied volatility) of 34.18, while the back-month option has an IV of 31.60. The back-month option IV typically is higher.
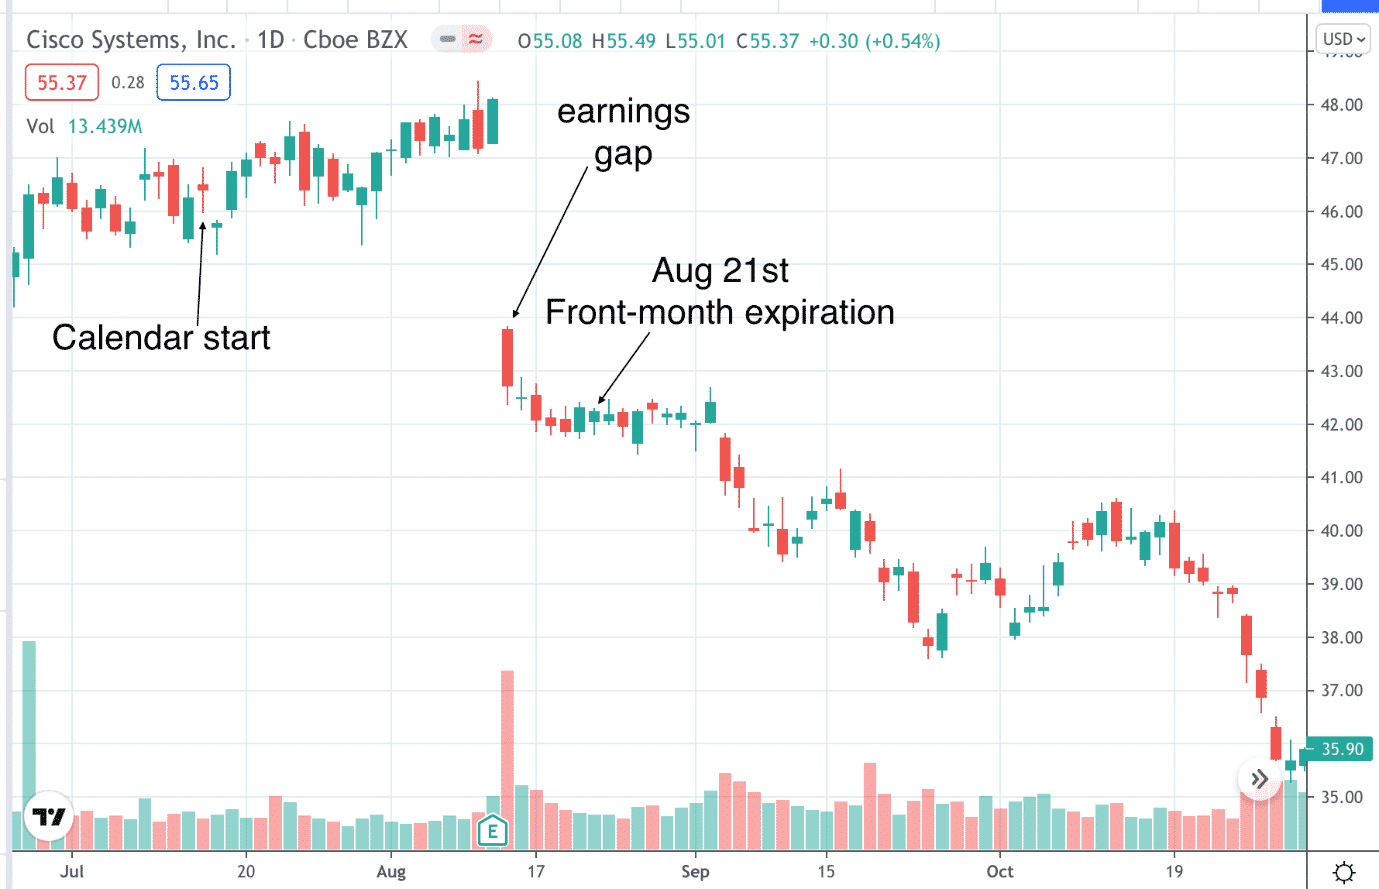
This abnormal skew is due to CSCO reporting earnings on August 12 after the market close.
The August 21 put option is in high demand to protect investors from any unpredictable event, which causes option price and IV to be high.
On July 27, the spread hit the conservative price target of $30.0, or 15% of initial debit.
Let’s suppose we are going for the aggressive target of 30% of potential max profit or a profit of $1500.
Unfortunately, this profit was not reached.
Near the end of the day on August 12, just before the earnings announcement, the P&L is showing $112.50.
The trade never left the tent nor touched the expiration breakevens.
The smart investor would exit the trade just before the market closes to avoid earning risk.
Download the Options Trading 101 eBook
But suppose the investor was not paying attention to the earnings date and continued with the trade.
The next day, CSCO price gapped down and went below the lower breakeven point.
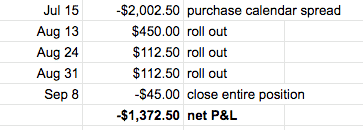
So, let’s roll the short put out in time one week at the same strike. We will receive a credit of $450
Date: Aug 13
Buy to close 45 Aug 21 CSCO $46 put @ $3.38
Sell 45 Aug 28 CSCO $46 put @ $3.48
Credit: 45 x $10 = $450
The price never recovered.
On the week of expiration with only four days left, we roll again further out in time.
Date: Aug 24
Buy to close 45 Aug 28 CSCO $46 put @ $3.85
Sell 45 Sep 20 CSCO $46 put @ $3.88
Credit: 45 x $2.50 = $112.50
Note that with each subsequent roll, the credits are getting smaller and smaller.
On August 31, we roll again, collecting another $112.50.
Date: Aug 31
Buy to close 45 Sep 4 CSCO $46 put @ $3.78
Sell 45 Sep 11 CSCO $46 put @ $3.75
Credit: 45 x $2.50 = $112.50
At September 11 expiration, we will not be able to roll out to the next week September 18 expiration at the same strike because that is where our long strike expiration is.
Rolling it there would be equivalent to closing out the entire position.
On Sep 8 three days till expiration, we give up and close out the position as follow:
Date: Sep 8
Buy to close 45 Sep 11 CSCO $46 put @ $6.00
Sell 45 Sep 11 CSCO $46 put @ $5.90
Debit: 45 x $10 = $45
Tallying all the credits and debits, this trade where price completely went against us, we had a net loss of $1372.50.
If we had not adjusted, the trade would have lost $1665 at the front-month expiration on August 21.
Conclusion
Now you know the basic calendar adjustments. In the next article, you will learn methods #3, #4, and #5 and working with LEAPS calendar and dual calendars.
Keywords:
Trade safe!
Gav.
Disclaimer: The information above is for educational purposes only and should not be treated as investment advice. The strategy presented would not be suitable for investors who are not familiar with exchange traded options. Any readers interested in this strategy should do their own research and seek advice from a licensed financial adviser.

The post Blog first appeared on Options Trading IQ.
Original source: https://optionstradingiq.com/adjusting-calendar-spreads/


