Today, we’re looking at the broken wing iron condor.
That is what Tim Pierson called it when he presented in this YouTube video.
When I saw his P&L results from 2014 and part of 2013 — it was an old video — I had to put this on my list to study and backtest.
He said he averaged about a 5% return on risk per month (70% annualized return) on a trade that does not need adjusting 95% of the time.
Contents
-
-
-
-
-
-
- Backtesting The Broken Wing Iron Condor
- Backwardation And Contango
- Structure Of A Broken Wing Iron Condor
- Risk To Reward
- The Greeks
- Trade Continues
- Adjustments
- Conclusion
-
-
-
-
-
Backtesting The Broken Wing Iron Condor
Manually backtesting this options structure using OptionNet Explorer for the same year 2014 on the RUT (Russell 2000 index), we got a profit of $5463 for the year with the largest trade using $13000 in margin.
So that would be a 42% annualized return, averaging 3.5% profit per month, which is not bad considering that the RUT moved up only 3.81% for that entire year.
The returns of our individual backtest trades are as follows.
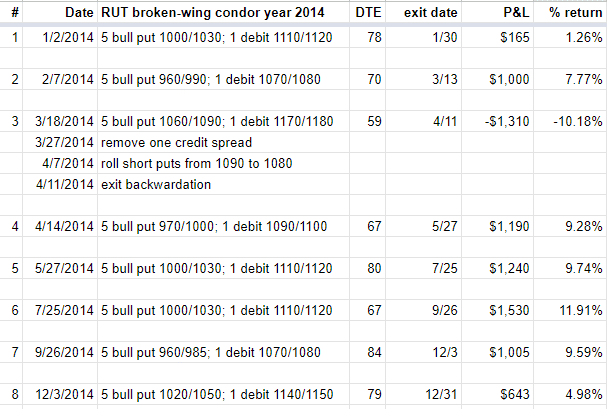
The last trade #8 shows the P&L on December 31st for purposes of the annual calculation.
But the trade would not have naturally ended until February 4th with a profit of $1132.50.
We are in no way doubting Tim’s results.
The returns can vary greatly depending on one’s trading style and rules and setup.
And we don’t know the details of what his are.
We ran this backtest to set up the trade with about 60 to 80 days to expiration on the monthly expiration cycle.
We initiate a new trade immediately after one completes — unless the VIX futures term structure is in backwardation.
Backwardation And Contango
Just like we would not put on an iron condor during backwardation, in those cases, as was on March 14th, we did not put on a trade.
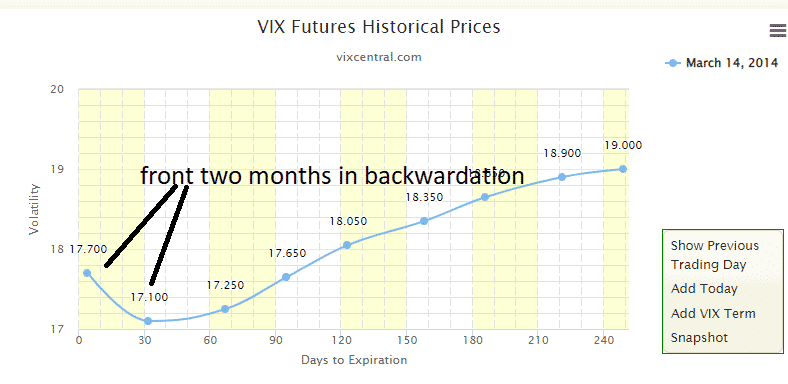
source: vixcentral.com
Until it went back into contango on March 18th.
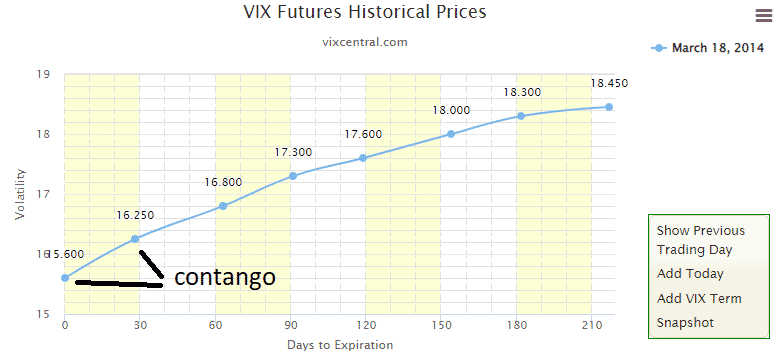
Whether to exit an existing trade when the market goes into backwardation is up to the trader.
We did exit trades #1 and #3 when the market went into backwardation.
Trades #7 and #8 were able to ride through the backwardation that occurred from October 9th through October 20th and December 12th through December 17th.
Structure Of A Broken Wing Iron Condor
The configuration we are testing consists of a bull put spread with multiple contracts.
The short strike is around the 15-delta. The long strike is around 11-delta.
A bear put debit spread is added just below the 40-delta.
Here is an example of what trade #6 looked like.
The prices shown are at 2 hours after the open.
Date: July 25th, 2014
Price: RUT at $1144.04
Five bull put spreads:
Buy five September 30th RUT 1000 put at $6.10
Sell five September 30th RUT 1030 put at $9.05
One put debit spread:
Sell one September 30th RUT 1110 put at $25.35
Buy one September 30th RUT 1120 put at $28.60
The trade gave net credit of $1,150 and a max risk of $12,850, with the payoff diagram looking like this.
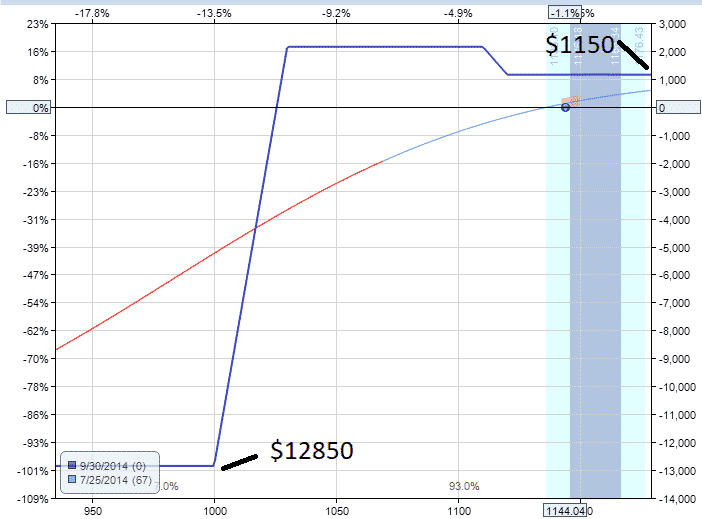
Because of the hump created by the debit spread, it is possible to result in a profit greater than $1150 out of the trade if held very close to expiration.
Risk To Reward
While the risk to reward ratio of 10 to 11 as configured does not sound great, note that this is only the theoretical risk to reward.
We have a mental stop loss to exit the trade whenever our P&L shows a loss of two times greater than the initial credit received.
We will not take a loss that is ten times greater than our win.
That would be a disaster indeed.
The theoretical risk to reward is high because the short strikes of the credit spreads are very far out of the money, which makes the trade less directional.
If we move the short strikes closer to the money, we will reduce the risk to reward ratio but make the trade more directional with a higher delta value relative to theta.
The Greeks
At the start of the trade, the Greeks are.
Delta: 17.01
Theta: 15.70
Delta/Theta ratio: 1.08
Gamma: -0.53
Vega: -111.99
The delta to theta ratio is at a healthy value of 1.08 for non-directional traders.
The addition of the debit spread to the RUT credit spreads makes the overall delta smaller.
You would not have a delta/theta ratio this low in a typical credit spread.
A broken wing condor is less directional than a credit spread.
But more directional than an iron condor, which can have a delta/theta ratio of 0.3 or less.
Trade Continues
On August 18th, with still 43 days till expiration, we have profits of $735, or 5.72% of the max risk.
In a regular credit spread or iron condor, we would exit the trade at this point since we had received greater than 50% of the initial credit in less than half the trade duration.
However, for this particular structure, another approach is to hold the trade as long as possible (as long as the Greeks are favorable) and treat it more like an income trade rather than a directional trade.
The payoff diagram and the Greeks at this point are:

Delta: 8.30
Theta: 13.91
Delta/Theta ratio: 0.60
Gamma: -0.52
Vega: -64.96
With the price sitting at this location on the risk graph, this trade right now has even less directional risk than when it first started.
The delta theta ratio has dropped to 0.6.
Vega volatility risk has dropped, and gamma is about the same.
For non-directional traders who would like to capture theta profits, they would rather stay in this trade with these Greeks than start up a new trade with a larger delta value.
For the directional traders with their technical analysis, they may rather close this trade and start a new trade that has a higher delta value so that when RUT moves up, they can make much more money.
The flip side is that for the directional traders, they can be wrong in the direction, in which case money would be lost.
For the non-directional traders, they don’t have to pick direction because time only moves forward.
But the profits are not as big as when the directional trader gets the direction correct.
Since we are not looking at the candlestick charts in this backtest, we will be non-directional traders and stay in this trade longer.
On September 9th, at this point here, with 21 days to expiration, our P&L is $1107.50, or 8.62%.
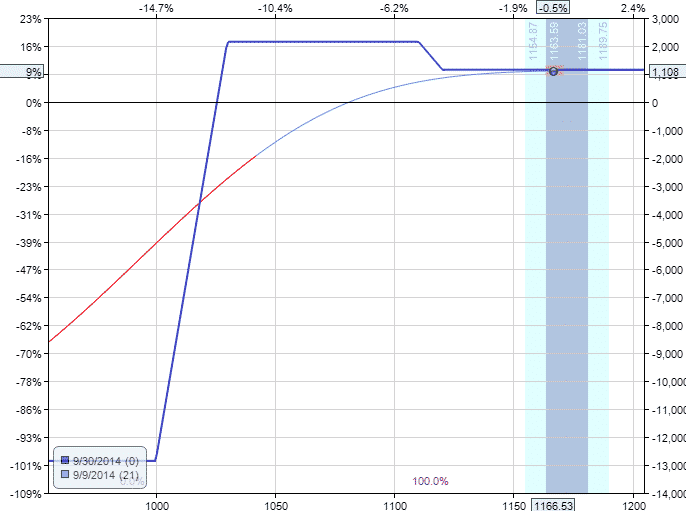
Delta: 1.42
Theta: 9.57
Delta/Theta ratio: 0.15
Gamma: -0.26
Vega: -17.80
The Greeks look fine, and the price is at the top of the expiration graph.
Some traders would exit here and start a new one, as we had done for trades #4 and #5.
However, we realized that we were leaving money on the table.
Unlike an iron condor, we are not constrained on the upside.
If the price continues to go up, we would always make at least the initial credit.
Our downside breakeven is so far below us that we feel comfortable staying until September 26th (day before expiration), where we captured profits of $1530, or 11.91%.
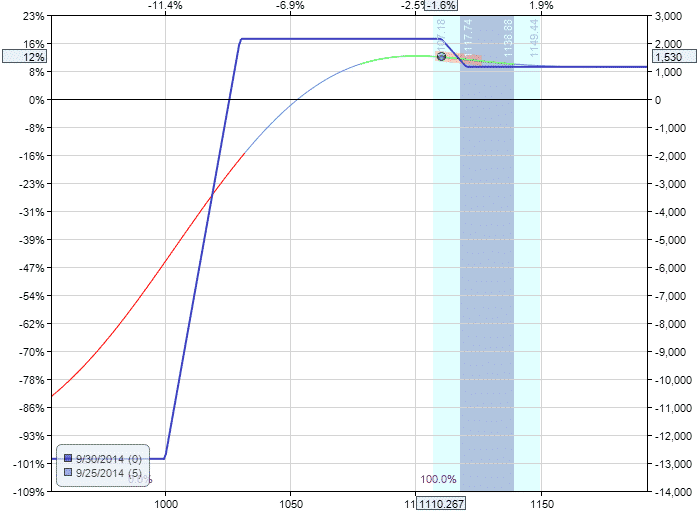
Note how this profit is greater than our initial credit received.
Unlike credit spreads, our max potential profit is greater than the initial credit received.
Adjustments
Let’s look at our losing trade #3. It started on March 18th, just like any of the other trades.
On March 27th, it was down 8%, with P&L showing a loss of over $1000.
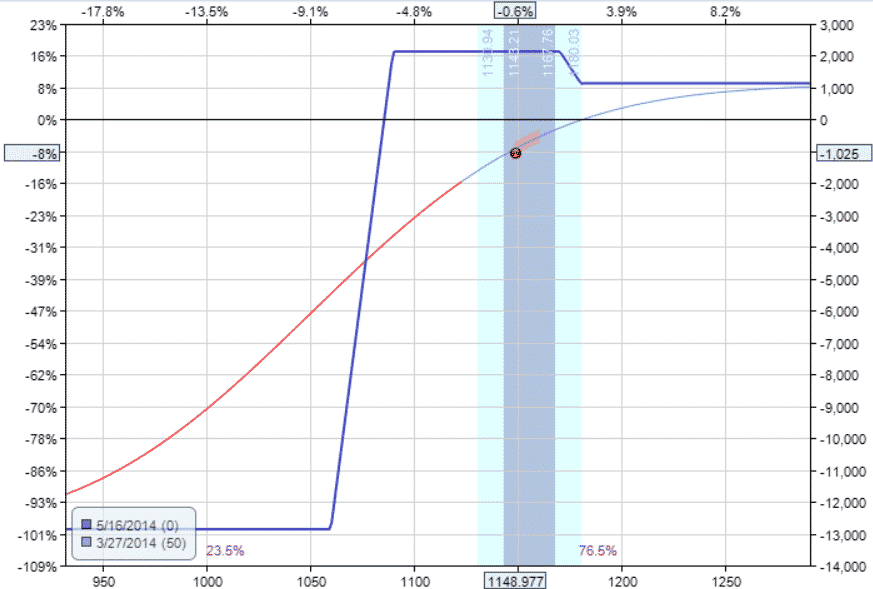
Delta: 34.66
Theta: 24.10
Delta/Theta ratio: 1.44
Gamma: -0.28
Vega: -139.04
We decided to make a minor proactive adjustment by closing one of the 5 credit spreads.
Sell to close one May 16th RUT 1060 put
Buy to close one May 16th RUT 1090 put
Our max risk decreased from $13,000 to $10,000, and the T+0 line is slightly less steep.
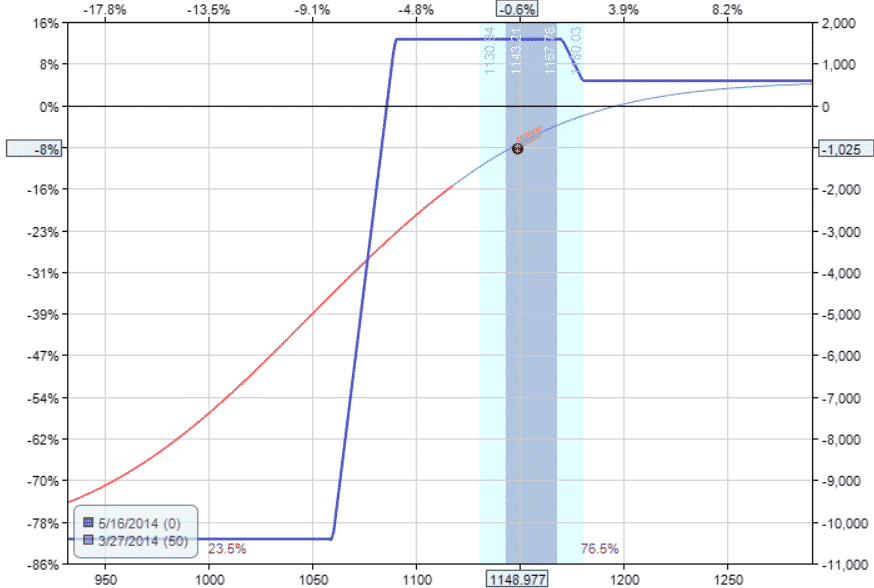
This is because the delta had decreased.
Delta: 26.72
Theta: 19.64
Delta/Theta ratio: 1.36
Gamma: -0.24
Vega: -112.61
We had sacrificed a little bit of theta; however, the decrease in theta was not as big as the decrease in delta, so this gave us a slightly more favorable delta/theta ratio.
Continuing to April 7th, we now need another adjustment because delta had reached over 30 again.
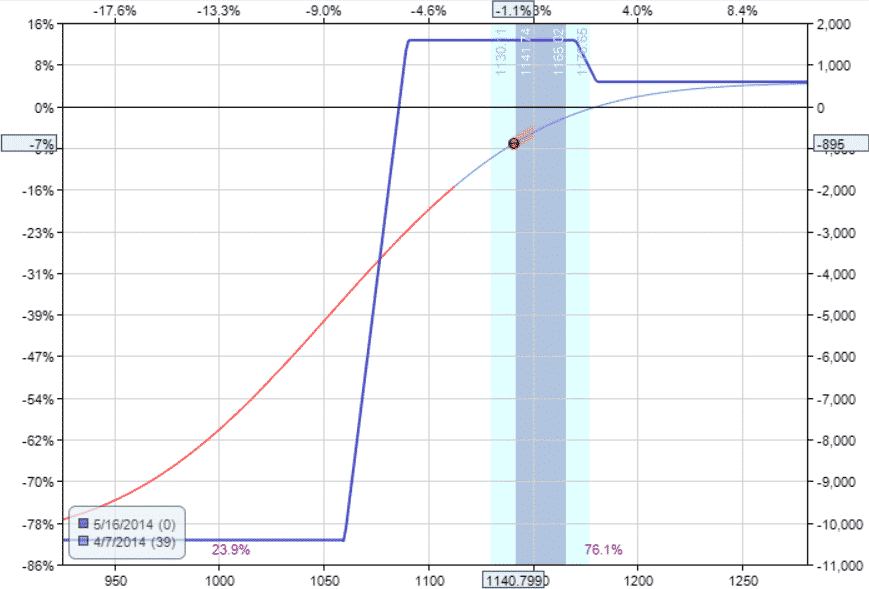
Delta: 30.49
Theta: 26.06
Delta/Theta ratio: 1.17
Gamma: -0.30
Vega: -113.93
This time, we will adjust by rolling the short puts of the credit spread from 1090 down 5 points to 1080.
Buy to close four May 16th RUT 1090 put Sell to open four May 16th RUT 1085 put
This results in a further decrease of our downside risk to $9000.
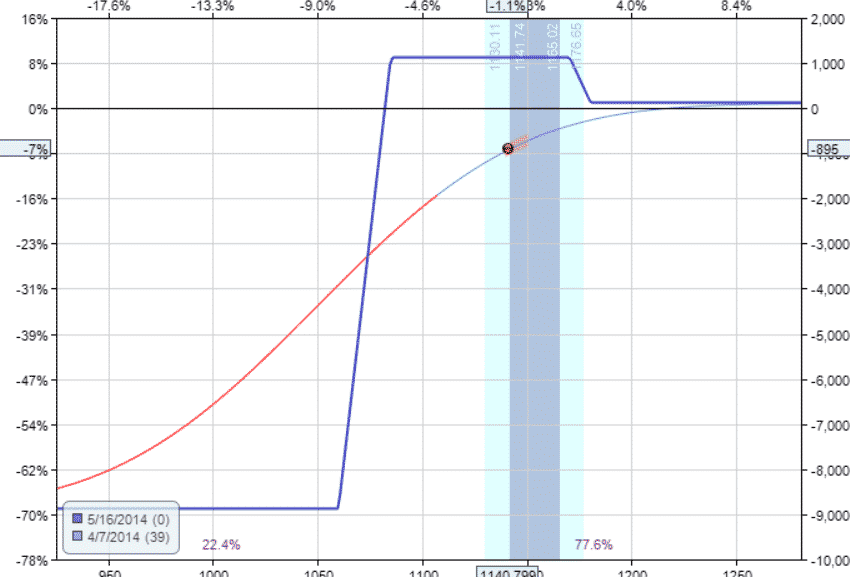
Delta: 23.57
Theta: 22.57
Delta/Theta ratio: 1.04
Gamma: -0.28
Vega: -97.01
We are managing our risk in case the market crashes straight down before we can get to the computer to exit the trade.
Note that each subsequent adjustment we make decreases our potential profit on the upside.
At this point, the upside profit at expiration is nearly zero.
That’s okay. If it gets back close to breakeven, we will exit the trade and start a new one.
On April 11th, the VIX futures term structure shows the market in backwardation.
So, we exit this trade with a loss of $1310, or -10.18%
Conclusion
The broken wing condor is basically a credit spread with a smaller debit spread attached to it.
This debit spread decreases the delta, making the strategy less directional than a credit spread.
Similar to the Trapdoor modification to the iron condor, the debit spread makes the T+0 line flatter which means less P&L change as the price moves.
In effect, it reduces price risk.
If you want to make it completely directionally neutral, you can add more debit spreads.
For example.
Date: April 11th, 2014
Price: RUT at $1126
Credit Spreads:
Buy five June 20th RUT 970 put
Sell five June 20th RUT 1000 put (70 days to expiration)
Debit Spreads:
Sell four June 20th RUT 1040 put
Buy four June 20th RUT 1060 put (70 days to expiration)
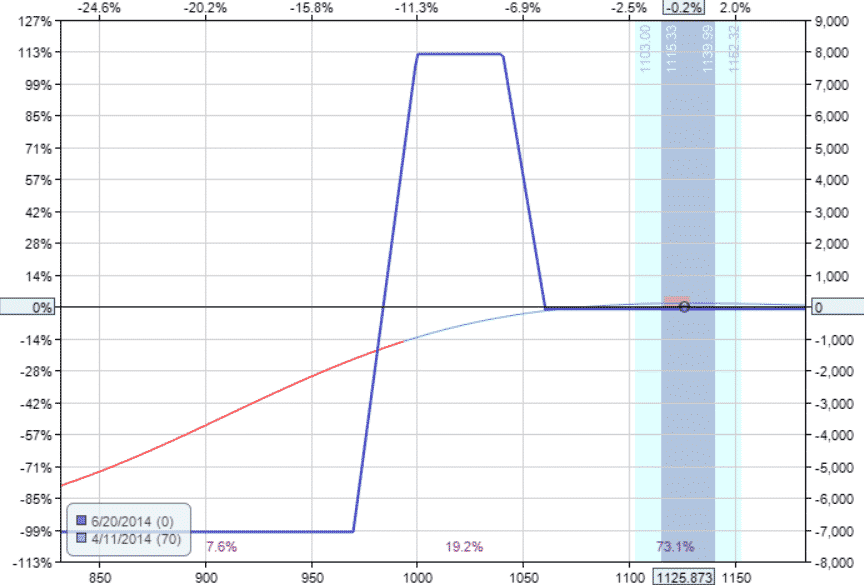
This results in a near-zero delta and theta that pays $8.76 per day.
Delta: 0.07 Theta: 8.76
Delta/Theta ratio: 0.01
Gamma: -0.47
Vega: -45.00
That may not sound like much.
But theta increases day by day.
After one month later, on May 15th, the theta is at $20.65 per day.
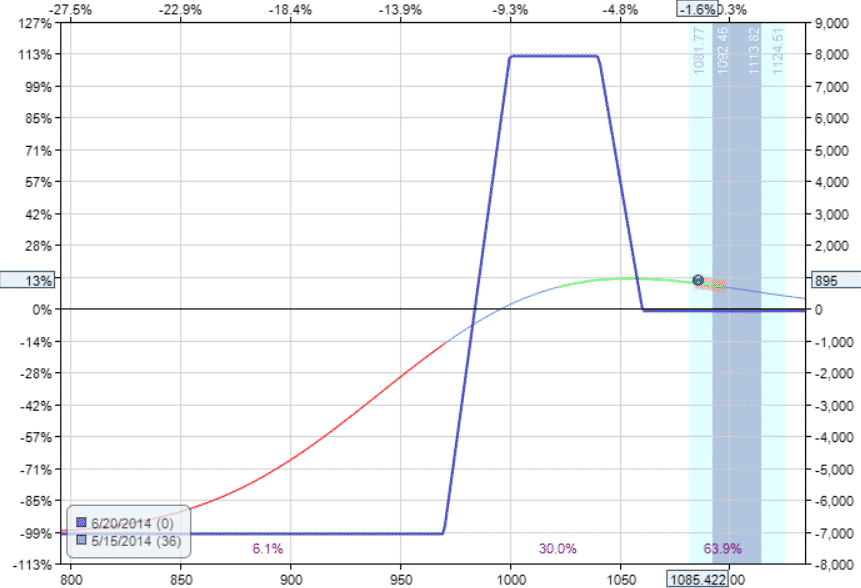
The trade is now in profit of $895, or 12.6% of the max capital at risk.
Want a slight hedge against a market sell-off?
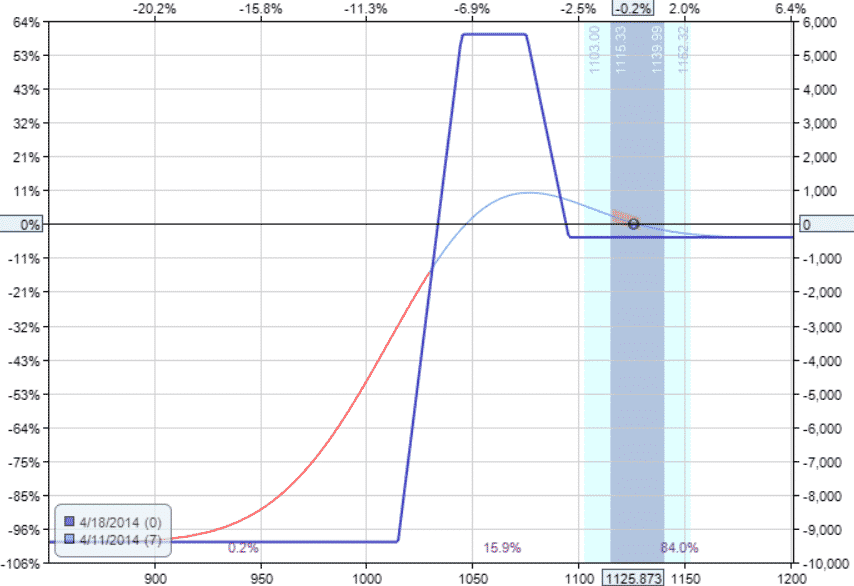
Start the trade with only 7 days to expiration instead of 70 days.
And move the credit spreads far out of the money like at the 4-delta.
Date: April 11th, 2014
Price: RUT at $1126
Credit Spreads:
Buy five April 18th RUT 1015 put
Sell five April 18th RUT 1045 put (7 days to expiration)
Debit Spreads:
Sell three April 18th RUT 1075 put
Buy three April 18th RUT 1095 put (7 days to expiration)
For traders who are tired of their price going against them in their credit spreads, consider the broken wing condor.
It will hurt less.
Price has to go through the debit spread’s profit zone before reaching the danger point of the credit spreads.
Trade safe!
Disclaimer: The information above is for educational purposes only and should not be treated as investment advice. The strategy presented would not be suitable for investors who are not familiar with exchange traded options. Any readers interested in this strategy should do their own research and seek advice from a licensed financial adviser.

The post Broken Wing Iron Condor: What Is It? first appeared on Options Trading IQ.
Original source: https://optionstradingiq.com/broken-wing-iron-condor-what-is-it/


