In a previous article, we discussed Tom King’s 1-1-2 option strategy.
It is great for investors who do the Wheel strategy or for investors that are fine getting assigned the stock or ETF.
That was why in our previous example, we did the 1-1-2 on the SPY ETF so that we could get assigned if needed to start a wheel trade.
However, some traders prefer not to have an unlimited risk strategy, such as the 1-1-2, which has two naked short puts.
Then others would like a lower margin requirement.
This defined-risk version satisfies both requirements.
Essentially, we sell put spreads instead of naked puts.
In this next example, we will do the defined-risk version of the 1-1-2 on the SPX index where we will not be able to get assigned the SPX even if we wanted to – since SPX is cash settled.
Date: June 27, 2023
Price: SPX @ 4347
Buy one August 31 SPX 4300 put @ $64.55
Sell one August 31 SPX 4260 put @ $55.20
Sell two August 31 SPX 4080 put @ $28.85
Buy two August 31 SPX 4020 put @ $23.50
Net credit: $160

Here we buy a 40-wide put debit spread with the long option at around 35 delta.
Then selling two 60-wide put credit spreads with the short option at around the 15 delta.
You may have to move these spreads around to get a net credit of some amount.
You want the total credit received from the credit spread to be more than what you paid for the debit spread.
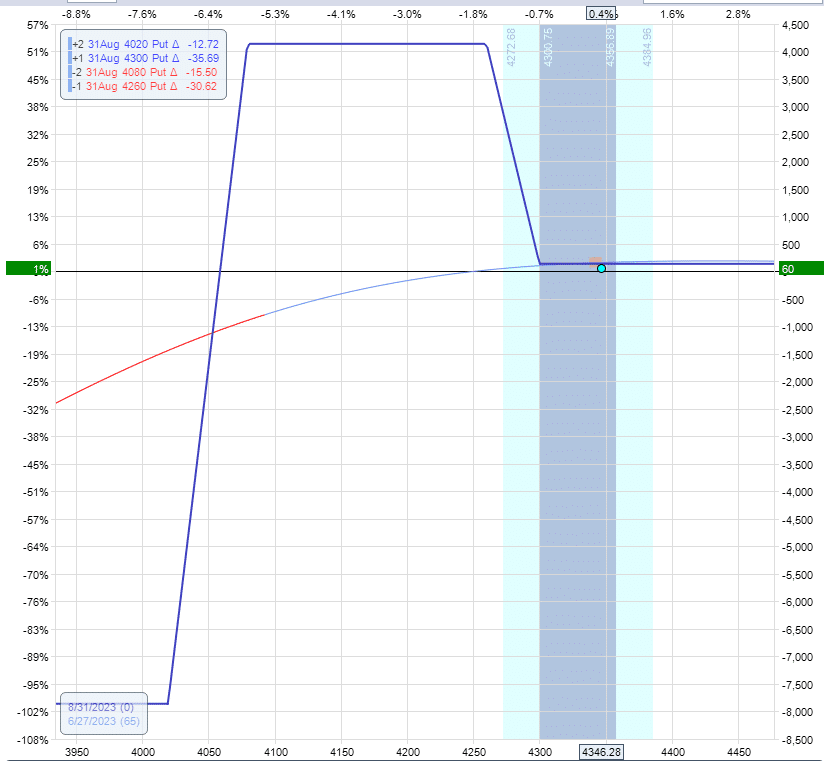
In our example, it is $160 more, which gives us no upside risk.
If SPX were to expire at the tail, we would collect that $160 in 65 days.
Roughly $80 profit in a month on a risk of $8,000 (as seen based on the risk graph).
We are just doing some rough calculations with round numbers here.
We can estimate the profit potential to be a 1% return on risk per month or a 12% return annualized.
Again, you can make the trade more aggressive for greater returns by adjusting the width of the spreads.
In the calculation, we did not consider the probability that some trades may expire while inside the trap, in which case we can get a profit of $4,000 on a trade with a risk of $8,000.
That’s a 50% return for that trade.
Other trades will be losers where we exit at our mental stop-loss point.
These are the trades where the price is about to overshoot the bear trap on the downside.
A good stop-loss point would be when the price goes down to the short strike of the put credit spread.
In our case, at 4080. If the price gets there fast early in the trade, we can potentially lose about $1000.
This is based on eye-balling the above graph.
You can also note that our mental stop-out point is around where the T+0 line turns blue to red.
I’m unsure what algorithm OptionNet Explorer uses to mark that color change.
But in this example, it happens to be where we would decide to exit the trade for a loss.
I don’t think the trade will be much of a problem in bullish years.
But use OptionNet Explorer to backtest this to see if the probabilities work out in bearish years.
Conclusion
The standard 1-1-2 strategy with its naked put options is fine for traders who can monitor and take timely corrective action if the trade goes against them.
However, there are appealing qualities to having a defined-risk trade.
Firstly, it has a lower margin requirement.
And secondly, there is built-in protection in the event that a trader cannot take timely corrective action due to circumstances beyond his or her control (such as life getting in the way, illness, or being preoccupied with more pressing matters, etc.).
We hope you enjoyed this article on the 1 1 2 strategy.
If you have any questions, please send an email or leave a comment below.
Trade safe!
Disclaimer: The information above is for educational purposes only and should not be treated as investment advice. The strategy presented would not be suitable for investors who are not familiar with exchange traded options. Any readers interested in this strategy should do their own research and seek advice from a licensed financial adviser.

Original source: https://optionstradingiq.com/1-1-2-strategy/


