A zero-cost collar consists of buying a put option and selling a call option to finance the cost of the put option.
When the correct strikes and expiration are chosen, this incurs no extra cost to the investor.
The option collar will hedge downside risk during earnings season, which can be volatile, as unexpected results or guidance shifts can cause sharp stock price swings.
We will explore how zero-cost collars work, their benefits and limitations, and how investors can use them to safeguard their positions during earnings announcements.
Contents
-
-
-
- Microsoft Example
- Risk Graph Of The Collar
- Post Earnings Gap Down
- Exiting At BreakEven
- List Of Transactions Of The Collared Investor:
- Conclusion
-
-
Microsoft Example
Suppose an investor owns 100 Microsoft (MSFT) stock shares on October 30, 2024.
It is trading at $436.46 per share in the morning.
With the earnings announcement coming after the market close that day, a portion of that $43,646 investment is at risk if the stock gaps down tomorrow morning.
The investor buys a put option with a strike price of $435 with an expiration of January 17, 2025 – about two and a half months away.
This enables the investor to sell at $435 per share anytime before expiration, regardless of the stock’s market price.
With this put option in place, the most the investor can lose from a drop in stock price is $146, the result of $43,646 minus $43,500.
However, this single-put option costs $1800.
Without wanting to incur this extra cost, the investor sells a call option above the current stock price with a strike price of $440.
This option has the same expiration date, January 17, 2025.
This is a covered call since the investor already owns 100 shares of the underlying stock.
The investor gets a credit of $2,060 from this sale, which is quite a good deal (perhaps the impending earnings event has caused the demand for options to increase along with higher implied volatilities).
This credit is enough to pay for the cost of the put option with money left over.
That money left over is also enough to compensate for the $146 of potential loss in equity calculated earlier.
In fact, there should be at least a net gain of $114 at expiration:
$2060 – $1800 – $146 = $114
Risk Graph Of The Collar
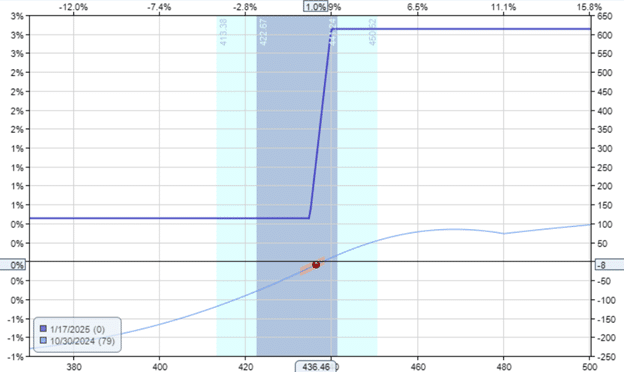
An investment position of 100 shares of stock plus a put option plus a short call option is known as a collar.
The collar limits the upside potential of the stock and the downside risk.
Here is the risk graph of the entire position (100 shares of stock plus the put option plus the short call option):

Post Earnings Gap Down
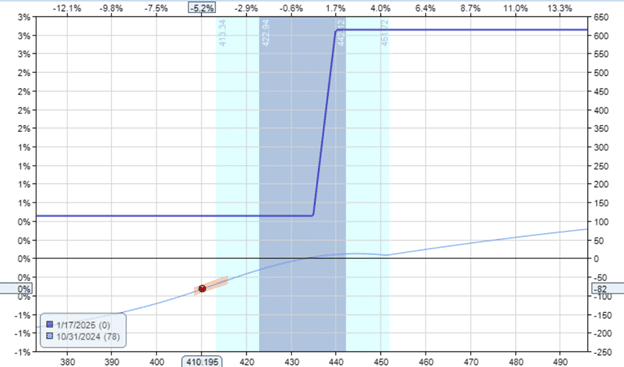
The next day after the earnings announcement, MSFT stock gapped down, opening at $415.36.
If the investor had not initiated the collar, that would have been a $2110 loss (from $43,646 to $41,536).
With the collar in place, it is only an $82 loss instead:

However, if the investor is willing to hold the collar until expiration, the position need not be at a loss.
The solid blue expiration graph shows the P&L at expiry on January 17.
It is completely above zero.
The lowest point on that graph is $114.
Exiting At BreakEven
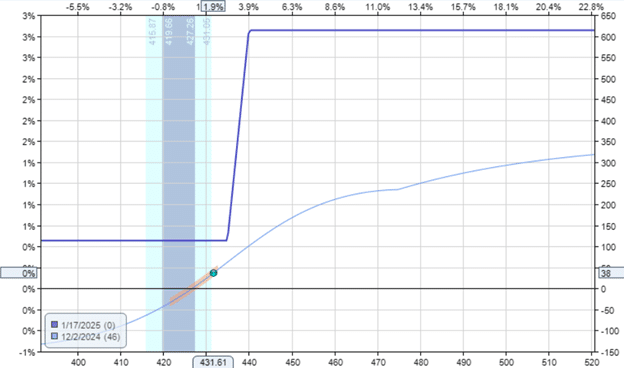
If that investor hadn’t wanted to wait until January 17, he could have exited the position without any loss about one month later on December 2, when MSFT rallied back up to $431.61.
Still not back up to its original pre-earnings price of $436.46, an unhedged investor would be down $485.
But the collared investor can now exit at breakeven.
List Of transactions Of The Collared Investor:
Bought to open put option: -$1800
Sold to open call option: $2060
Now selling 100 shares of MSFT: $43,161
Sell to close the put option: $1140
Buy to close the call option: -$885
Total: $43,676
The list of transactions shows that the investor can recover the pre-earnings equity amount of $43,646.
The risk graph on December 2 looks like this:

The investor could get back to breakeven only because Microsoft rallied back up a little bit.
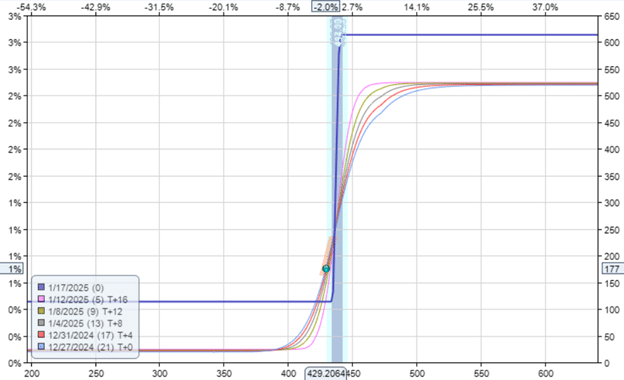
Looking at the T+0 risk curve, it is possible that the position would still be at a slight drawdown if Microsoft continued down.
In that scenario, the investor simply needs to wait a bit longer.
Eventually, the T+0 curve must come up to converge with the expiration graph.
This example happened on December 27, two months after the collar was in place.

At this point, the collared investor has no loss, regardless of the price at which MSFT happens to be.
All risk curves are above zero across all price ranges.
Conclusion
A zero-cost options collar can be useful for investors who are nervous about a stock’s earnings but don’t want to sell the stock.
While it eliminates the loss from a bad earnings report, it also limits the gain of positive earnings.
We hope you enjoyed this article on protecting a stock from earning risk with a zero-cost collar.
If you have any questions, please send an email or leave a comment below.
Trade safe!
Disclaimer: The information above is for educational purposes only and should not be treated as investment advice. The strategy presented would not be suitable for investors who are not familiar with exchange traded options. Any readers interested in this strategy should do their own research and seek advice from a licensed financial adviser.

Original source: https://optionstradingiq.com/earnings-risk-hedging-with-zero-cost-collars/


