Fear is starting to become an issue. Traders are starting to realize inflation, CPI, PPI, and global currencies are reacting to the sudden policy shift by the US Fed and global central banks. This fear is showing up in the Gold-to-Silver ratio as well.
My research suggests the closest comparison to the current Gold/Silver setup may be found by looking at the early 2000~2003 US markets. Let’s investigate this setup a bit further.
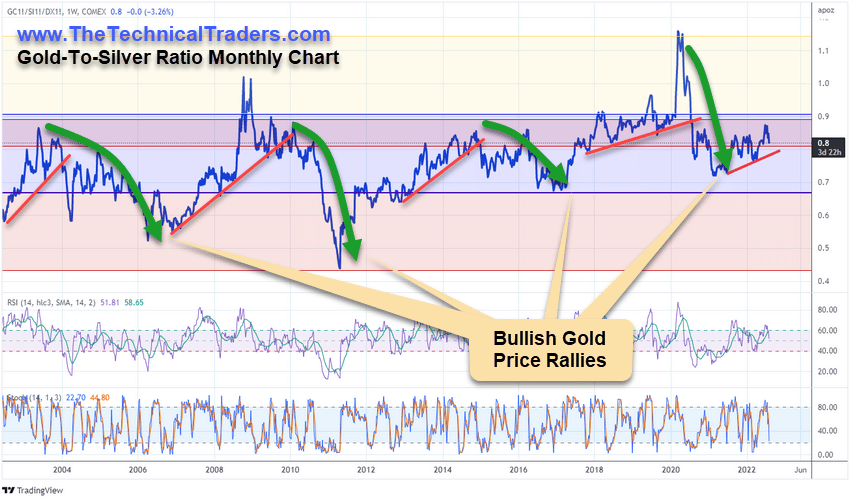
Gold-To-Silver Ratio Peaks Above 1.2 During COVID crisis
Over the past 5 years, Gold consolidated from 2017 through the COVID Virus event. This consolidation is prompting an extreme high in the Gold-to-Silver Ratio to levels above 1.2. The only other time in history when the Gold-to-Silver Ratio reached levels above 1.2 was in 1991~92. This is aligning with the fall of the Soviet Union.
This extreme peak in the Gold-to-Silver ratio marks a very weak Silver price compared to Gold. Psychologically, this represents a very real lack of fear related to global currencies/economies. The threat of extreme inflation trends.
Now, as inflation suddenly became a topic near the end of 2021, the Gold-to-Silver ratio has moved decided downward. This illustrates Silver is rallying compared to the price of Gold as fear begins to elevate across the globe. Traders, consumers, and others are moving assets into precious metals near recent price lows to hedge against uncertainty, inflation, and currency devaluation.
The Fall Of The Soviet Union Was A Global Catalyst Event – Just Like COVID
The collapse of the Soviet Union prompted a global shift in how global currencies, threats, and opportunities were perceived. It also ushered in a new wave of capitalism throughout Russia that prompted a massive credit/economic expansion phase aligned with the birth of the Internet in the early 1990s. This is why we see Gold price levels stay rather muted from 1989 through 2002-03. It was a time of very little fear when global traders chased deals, DOT COM stocks, and Real Estate instead of precious metals.
After the DOT COM bubble burst, and the 9/11 terrorist attacks rattled global financial markets, fear and precious metals suddenly came into focus again. The rally that took place after 2001 in Gold prompted a nearly 600% increase (from $260 to $1923). The biggest portion of this rally took place after the 2007-08 Global Financial Crisis.
Is today any different than 2000~2002 in reality?

The similarities seem too obvious to ignore…
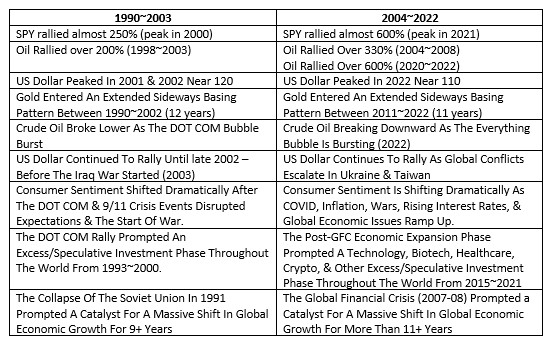
I believe a continued decline in Crude Oil, as well as a continued strengthening of the US Dollar, will likely take place throughout the end of 2022. In the meantime, Gold attempts to climb back toward recent highs. The catalyst for the breakout rally in Gold and Silver will likely be some extended breakdown in the US/Global financial markets and stocks or some new War/Aggression that pulls the US/EU into a conflict.
Overall, I believe global currencies will continue to recoil because of risk/devaluation factors related to inflation and disruptions within the global economy; very similar to the end of the Soviet Union in 1991.
My thinking is that Gold will attempt to hold above $1700 as a base support level while Silver attempts to hold above $19.00 as base support. Any major crisis event, war, or global financial meltdown may prompt a retest of these base support levels within the next 12+ months.
If Gold/Silver Are Repeating A 2002-03 Setup, What Can We Expect In The Future?
Then the breakout trend starts in Gold, which could happen as early as 2023 or 2024, I believe the next rally target for Gold will be somewhere above $3100. Then, we start a dedicated climb to levels above $4500 and beyond.
It is difficult to predict any date targets for this type of rally, but I’m trying to illustrate what I see related to the similarities of the 1989~2003 market conditions with what I’m seeing right now. If you were around to live through this incredibly exciting time, you may remember many of these events. I’m suggesting we may be starting to move through similar events right now and I suspect we are somewhere near August 2000 right now.
HOW CAN WE HELP YOU LEARN TO INVEST CONSERVATIVELY?
At TheTechnicalTraders.com, my team and I can do these things:
- Safely navigate the commodity and crude oil trend.
- Reduce your FOMO and manage your emotions.
- Have proven trading strategies for bull and bear markets.
- Provide quality trades for investing conservatively.
- Tell you when to take profits and exit trades.
- Save you time with our research.
- Proved above-average returns/growth over the long run.
- Have consistent growth with low volatility/risks.
- Make trading and investing safer, more profitable, and educational.
Sign up for my free trading newsletter, so you don’t miss the next opportunity!
We invite you to join our group of active traders who invest conservatively together. They learn and profit from our three ETF Technical Trading Strategies. We can help you protect and grow your wealth in any type of market condition. Click on the following link to learn how: www.TheTechnicalTraders.com.
Chris Vermeulen
Founder & Chief Market Strategist
The post Gold-to-Silver Ratio Heading Lower – Setup Like 1989-03 appeared first on Technical Traders Ltd..
Original source: https://www.thetechnicaltraders.com/gold-to-silver-ratio-heading-lower-setup-like-1989-03/


