How often does the VIX go above 60?
The answer is not very often.
Over the past 20 years, the VIX has gone above 60 only three times.
Contents
-
-
-
-
-
- What Is The VIX?
- What Did SPX Do That Caused VIX To Go Above 60?
- What Caused The Sell-off On August 5, 2024, Which Caused VIX To Go Above 60?
- Were There Warning Signs?
- Summary
-
-
-
-
As we are in September 2024, here is the monthly chart of the VIX:
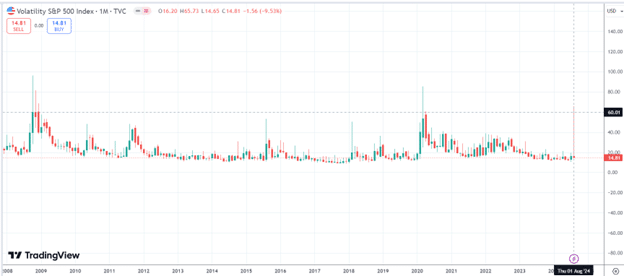
Don’t worry if the chart is too small.
We will zoom in later.
As long as you can determine the year on the bottom axis, you can see that the timing of VIX going above 60 corresponds to the 2008 financial crisis and the 2020 Covid pandemic.
Then the VIX went above 60 again on Monday, August 5, 2024:
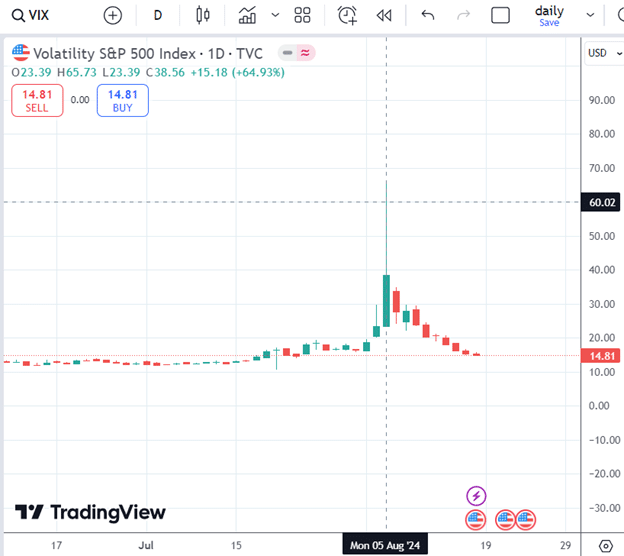
However, on that day, the VIX was above 60 for only about half an hour.
But it still counts.
The VIX was above 60 for multiple days in the other two instances.
During the height of the financial crisis, the high VIX lasted from October 9, 2008, through December 5, 2008.
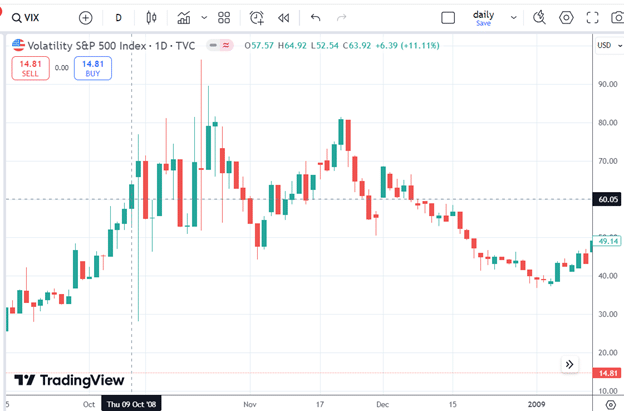
Nevertheless, there were a few days when the VIX was below 60.
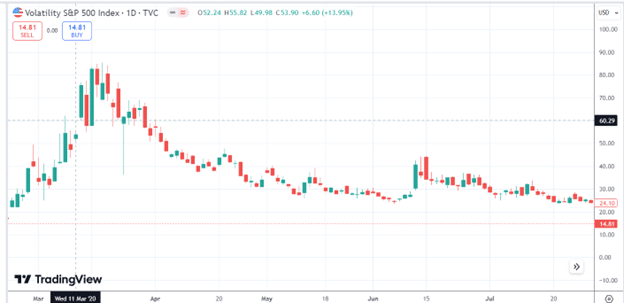
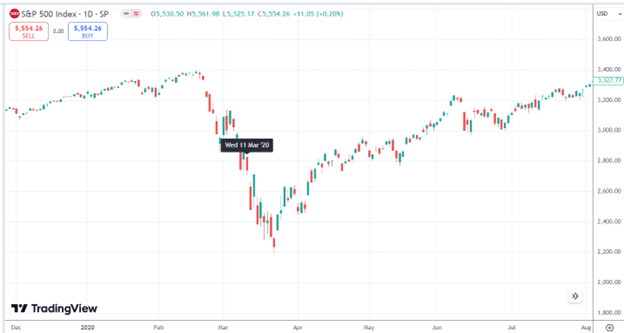
During the Covid pandemic, VIX was above 60 from March 11, 2020, through March 30, 2020 – nearly three weeks.
What Is The VIX?
Before we go any further, perhaps we should explain what the VIX is.
While some of you already know and can skip this section, we like to write for readers of all levels.
VIX is the Volatility Index of the S&P 500 index (SPX). You can see the value of the VIX as calculated by the Chicago Board Options Exchange (CBOE) by typing it in as the ticker symbol in your charting software.
Its value is derived from the prices of SPX index options with shorter-term expiries.
The VIX represents the 30-day forward projection of SPX volatility.
The VIX is sometimes known as the “Fear Index” because it goes up when a sell-off in the SPX makes investors “fearful.”
What Did SPX Do That Caused VIX To Go Above 60?
When the SPX price drops significantly, investors buy more protective put options in relation to call options.
This causes the value of put options to go up, and the calculated VIX value goes up.
During the financial crisis, the SPX was already experiencing a downtrend.
On October 9, 2008, when the VIX surpassed 60, the SPX was on its 7th consecutive red-candle down day.
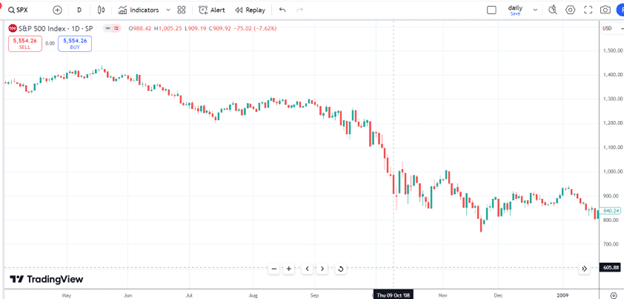
While it may not look scary in a historical chart that is more than 15 years ago, I’m sure some investors at the time were quite fearful.
The 2020 market crash looked more fearful on the chart because it happened more abruptly.
On March 11, 2020, when the VIX went above 60, the SPX was already on its second leg down.
What Caused The Sell-off On August 5, 2024, Which Caused VIX To Go Above 60?
The VIX spike above 60 on August 5, 2024, surprised many investors (including seasoned ones).
From the close of Friday, August 2, to the open of August 5, the SPX gapped down from 5346.55 to 5151.14, a massive 195-point drop:
And it did break the support level at 5200.
During the weekend overnight hours, Japan had a 12% sell-off as their banks tightened monetary policies to stabilize the yen.
This further exacerbated investor fears of a recession in addition to the sell-off on the Friday before.
That Friday, the release of economic data reported that non-farm payroll was lower than expected, the unemployment rate came in higher than expected, and factory order reports missed expectations significantly.
The market was in an overbought condition, and these might be the news catalysts that drove the value back down.
Were There Warning Signs?
During the 2008 financial crisis, the VIX Futures term structure was in backwardation from October 16, 2008, to December 10, 2008.
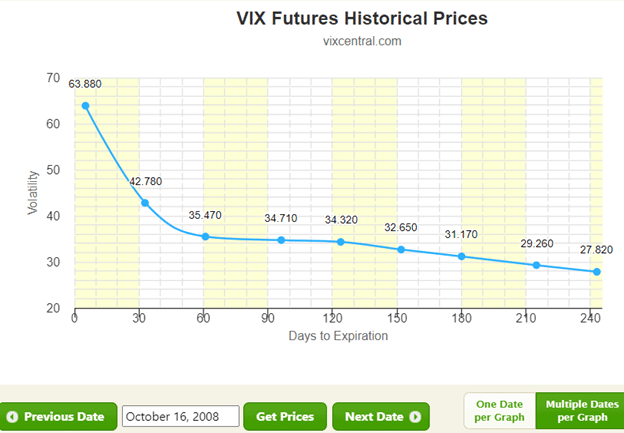
It was likely in backwardation before then when VIX went up to 60, but I don’t have data back that far.
For the pandemic VIX rise in 2020, the VIX futures went into backwardation on February 24, 2020, weeks before the VIX reached 60 on March 11.
It continued to be in backwardation until May 7, when the first two months of volatility came back into contango, even though the rest of the curve still appears to be in backwardation:
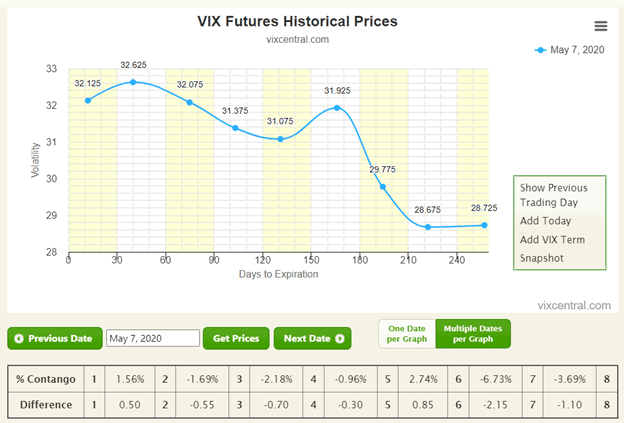
For the VIX spike on August 5, 2024, the market was also in backwardation on that day.
And did not get back to contango until August 14.
Summary
The VIX rarely goes above 60.
When it does, it is often accompanied by the VIX Future term structure going into backwardation before or on the day of that happening.
It happened three times in the past 20 years:
- In 2008, most of the countries in the world were in a financial crisis.
- In 2020, the world was in a pandemic caused by a new virus.
- In 2024, the fears of recession due to economic events.
If the VIX does go above 60, it would be due to some major geo-political or social-economical or some worldwide event that would be on the news that everyone would know about.
We hope you enjoyed this article about how often the VIX goes above 60.
If you have any questions, please send an email or leave a comment below.
Trade safe!
Disclaimer: The information above is for educational purposes only and should not be treated as investment advice. The strategy presented would not be suitable for investors who are not familiar with exchange traded options. Any readers interested in this strategy should do their own research and seek advice from a licensed financial adviser.

Original source: https://optionstradingiq.com/how-often-the-vix-goes-above-60/


