

The strategy commonly referred to as “buy the dip” is where an investor buys (or goes long) an underlying asset that has dropped in price but is expected to rebound and continue on its longer uptrend.
Contents
-
-
-
- Step 1:
- What Is The PSAR Indicator?
- Step 2:
- Sell The Rally
- Final Thoughts
-
-
Step 1:
In order to buy the dip, the first step is to have a longer-term uptrend in place.
You can determine this by:
- Higher highs (H1 and H2) and higher lows (L1 and L2)
- Upsloping trendline (black line)
- Price above an upward-sloping 20-period simple moving average (blue line)
- Or the 50-period moving average (red line)
- The eight exponential moving average stacked above the 21 EMA
- Price above the Ichimoku cloud etc

Here, we use a simple 20-day moving average, which slopes up, to indicate that Amazon is in an uptrend.
It dips back to the moving average and drops below it on November 22, 2024.
At this point, we don’t know if it will break the trend or continue the uptrend.
Three candles later, it crossed back up above the moving average.
So, from the price action, it looks like the uptrend will continue.
But let’s wait for confirmation with the PSAR indicator.
What Is The PSAR Indicator?
It stands for Parabolic SAR (Stop and Reverse), which was developed by J. Welles Wilder Jr. in 1978.
It is primarily used to identify potential reversal points in the price direction of an asset and to set trailing stop-loss levels.
If the price is above the PSAR dot, it is bullish.
The indicator would suggest placing a stop below the price at the PSAR dot.
If the price is below the PSAR dot, it means bearish.
And the indicator would suggest placing a stop at the PSAR dot if one were shorting the stock.
When the dot shifts from being above the price to being below the price, that indicates a trend change from bearish to bullish.
When the dot shifts from being below the price to being above the price, that indicates a trend change from bullish to bearish.
Many traders like to take signals as soon as the trend changes rather than enter in the middle of a trend (if you enter late, the trend may break).
Step 2:
Since Amazon’s longer-term trend is bullish, we are looking for the PSAR to indicate a shorter-term bearish trend that is shifting back to the longer-term bullish trend.
The PSAR indicator switched from bearish to bullish on December 2.
Buying on that day or even the next would work out in this case.

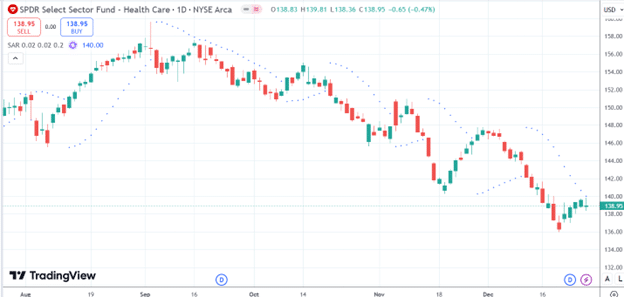
Sell The Rally
The concept applies in the opposite direction as well.
Here, we “sell the rally” as the bearish PSAR shows up, indicating that XLV (S&P 500 healthcare sector ETF) is about to continue on its longer-term downtrend:

And it did:
Final Thoughts
While the PSAR and the moving average give you the entry signal, the key is to decide when to exit.
Exiting too soon, you may not get big enough wins to cover your losses.
Exiting too late, and you may give back all your gains.
Some have suggested letting the PSAR provide the “reverse” or exit signal, which often means waiting for the stock to hit the suggested PSAR stops.
Others have found that this technique results in very late signals, often turning a winning trade into a losing one.
This can be seen in the example here where a trader might short XLV upon seeing the bearish PSAR signal:
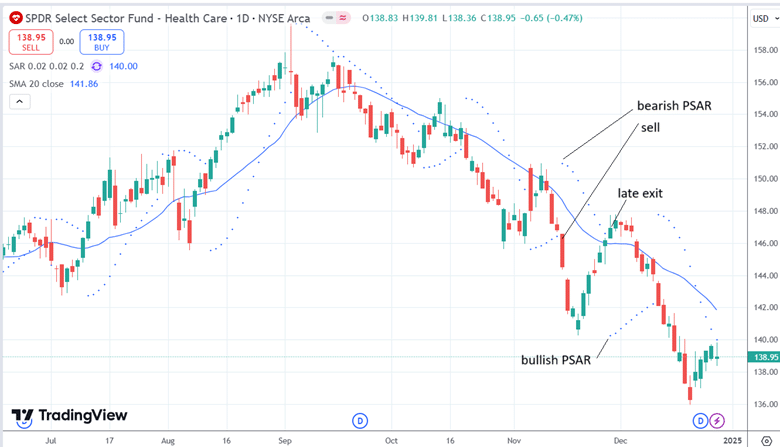
It worked, and the stock went down.
Only to V-bottom and reverse back up to where it had started before the PSAR reverse signal came.
We are using the default TradingView settings for the indicator:
Start: 0.02
Increment: 0.02
Max value: 0.2
These settings determine how the indicator calculates and plots the trailing stop points.
Adjusting them can make the PSAR more sensitive, but it would also provide a greater number of false signals.
Internally, it uses an “acceleration factor.”
The start value is the starting acceleration factor when a new trend begins.
A higher starting value makes the indicator more sensitive to price changes.
The increment value is how much it speeds up during the trend as new highs (in an uptrend) or new lows (in a downtrend) are achieved.
The max value is the maximum value the AF can reach, even if the trend continues for an extended period.
Some use the PSAR for entry but decide to use price action or amount of profit to determine exits.
Others implement their directional views using options.
With the added element of time decay, they provide the trader with a greater probability of profit when the stock doesn’t move or even go in the wrong direction a little bit.
Play with this strategy to see if it works for you.
But make sure to clean your monitor screen first.
You don’t want to mistake a spec of dust as a PSAR dot.
Because sometimes these tiny PSAR dots are a bit difficult to see.
We hope you enjoyed this article on how to buy the dip with the PSAR indicator.
If you have any questions, please send an email or leave a comment below.
Trade safe!
Disclaimer: The information above is for educational purposes only and should not be treated as investment advice. The strategy presented would not be suitable for investors who are not familiar with exchange traded options. Any readers interested in this strategy should do their own research and seek advice from a licensed financial adviser.

Original source: https://optionstradingiq.com/how-to-buy-the-dip-with-the-psar-indicator/