We will learn what a synthetic stock position is, how to create one, why we might want one, and whether it really replicates a stock position.
A profit loss graph depicts a typical stock position as such:
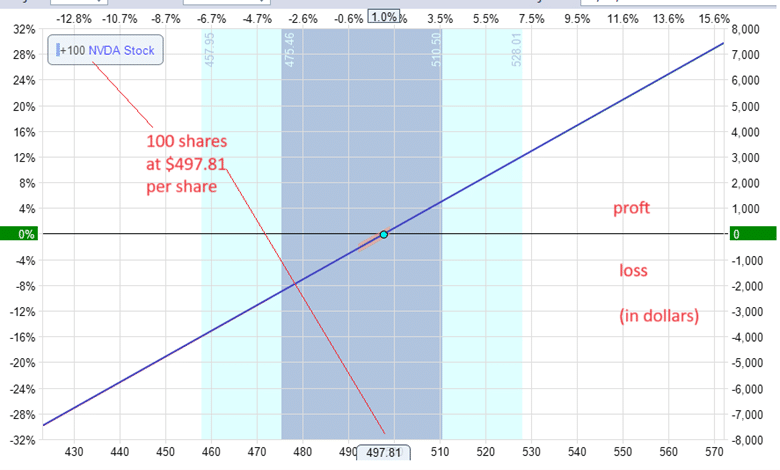
The graph simulates the profit/loss for an investor who bought 100 Nvidia stock (NVDA) on November 20, 2023, when NVDA was selling for $497.81 per share.
The asset price is shown on the horizontal axis at the bottom.
The profit or loss is shown as dollars on the vertical axis on the right.
The blue line indicates that as the asset price goes up, the profit goes up.
We say that this position has unlimited reward potential because it appears that the line will extend forever, even though we know that no stock will go up forever (even the best of companies will shut down someday).
Ignoring the nuances of reality, we also say that this position has unlimited risk, even though the most the investor can lose is $49,781 (when the stock price goes to zero).
Contents
-
-
-
-
-
- A Synthetic Stock Position
- Does It Behave Exactly Like the Stock?
- Why A Synthetic Stock Position?
- What Is The Downside Of The Synthetic Stock Position?
- What Are The Greeks Of The Synthetic Position?
- Why Is The Synthetic Position Not Exactly Like The Stock Position?
- What Happens To The Synthetic Stock Position At Expiration?
- Is The Synthetic Stock Position A Risk Reversal?
- Conclusion
-
-
-
-
A Synthetic Stock Position
A synthetic stock position has a similar graph but does not need to buy 100 shares of stock and pay $49,781.
Instead, the investor sells one put option and buys one call option.
Suppose on the same day, November 20, 2023, the investor sells the $500-strike put option expiring on March 15, 2024 (about four months later).
The price of that put option is selling for $47.13 on a per-share basis.
One contract of the put option represents 100 shares. Selling one contract gives the investor a credit of $4713.
The profit/loss graph of the short put position is:
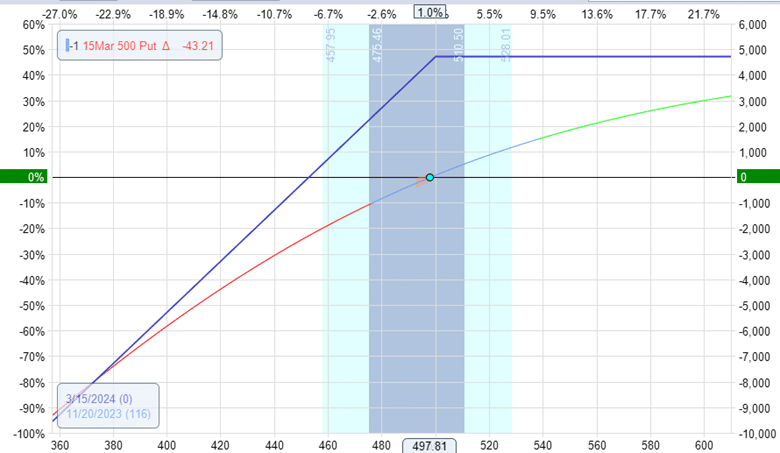
It has unlimited risk.
The blue line is the profit/loss at the option’s expiration.
Because the profit/loss curve changes over time, we also show that current time profit/loss curve as that green/red curved line.
To form the synthetic options position, the investor simultaneously buys the $500-strike call option expiring on March 15, 2024; the investor would pay $5353.
The profit/loss graph of the long call position would show that it has unlimited upside reward potential:
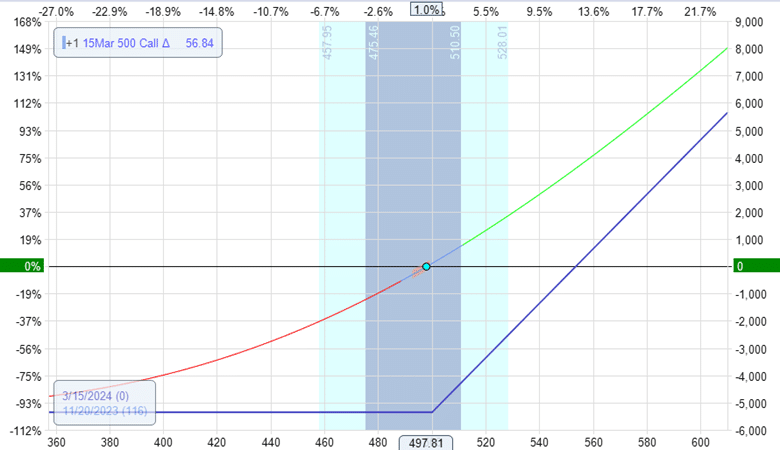
Since the investor is selling a put and buying a call in the same order, we combine the two graphs to get the following position:
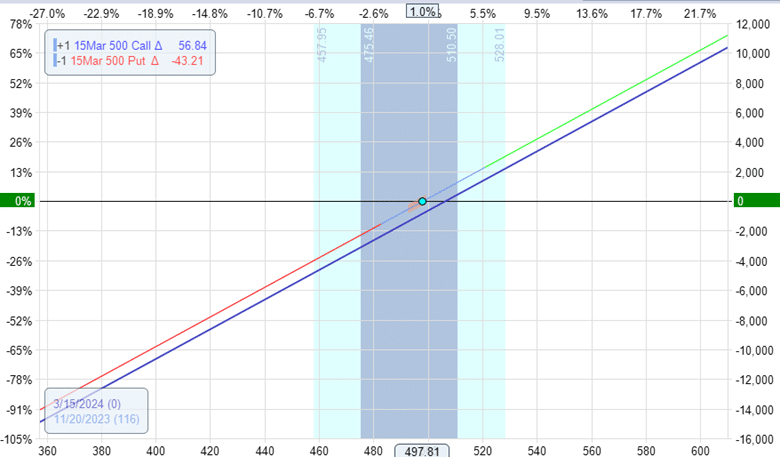
This synthetic stock position looks similar to that of the stock position graph.
It has unlimited reward (from the long call) and unlimited risk (from the short put).
Does It Behave Exactly Like the Stock?
On December 4, 2023, NVDA’s stock price dropped to $450.66.
This is a loss of $4715 on the stock profit loss graph:
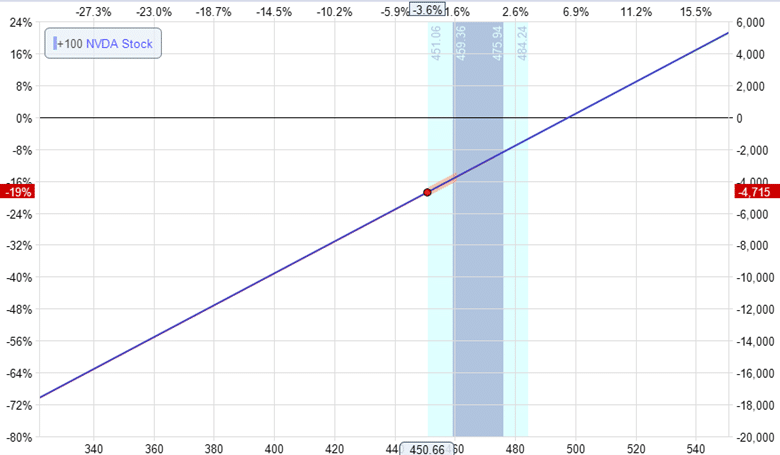
This makes sense since $497.81 – $450.66 = $47.15
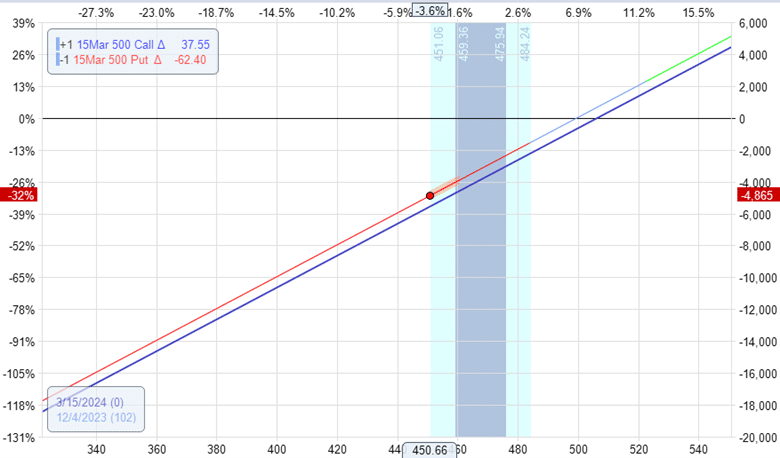
On the synthetic stock position, it shows a similar (but not exact) loss of -$4865.
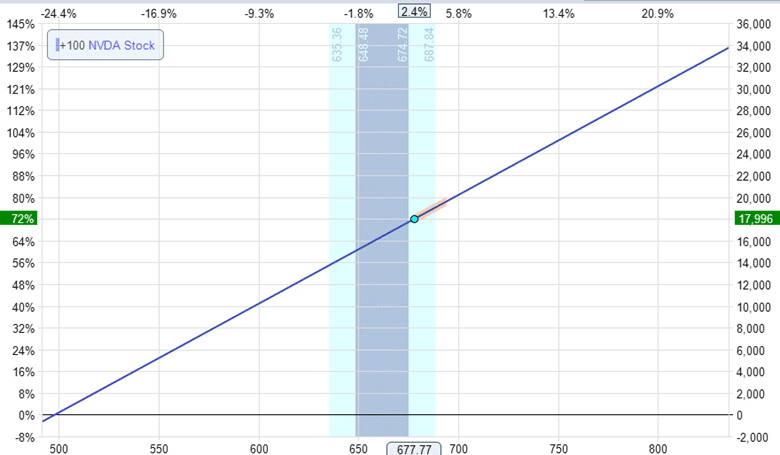
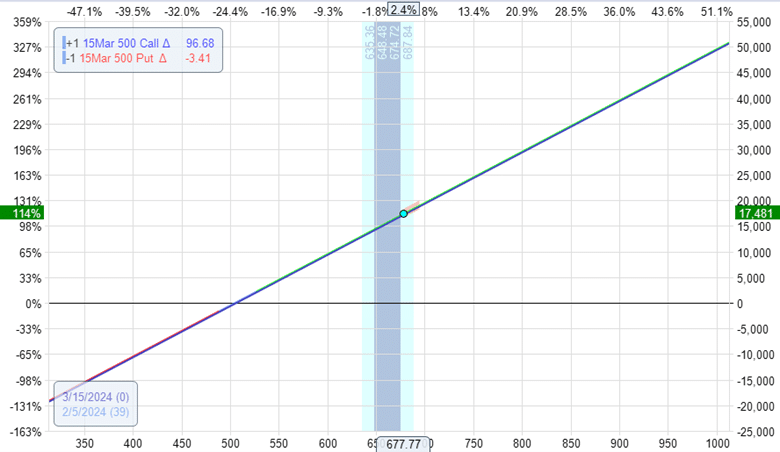
Taking the position longer out in time to February 5, 2024, we see that NVDA has risen to $677.77 per share, giving the stock investor a profit of $17,996.
The synthetic position made a similar (but not exact) profit of $17,481:
Why A Synthetic Stock Position?
To achieve the synthetic stock position, the investor paid a net price of $640 for this position.
Since $5353 – $4713 = $640
The investor will need more than $640 in the account because an extra margin is associated with the short put option.
Depending on the type of account and margin limits, it is possible for this investor to not have the full $49,781 in the account that the stock investor would need to have to get the same position.
This is the primary benefit of the synthetic stock position
What Is The Downside Of The Synthetic Stock Position?
Since the investor does not own the stock, the investor does not get any dividends the stock might offer.
The synthetic position has an expiration date since the put and call option has an expiration.
What Are The Greeks Of The Synthetic Position?
The Greeks will be similar (but not necessarily exactly) to that of the stock position. The Greeks of the stock position are:
Delta: 100
Gamma: 0
Theta: 0
Vega: 0
The Greeks, as modeled by the OptionNet Explorer software, are:
Delta: 100.11
Gamma: 0
Theta: -6.70
Vega: 0
What is interesting is that the option position has a negative theta.
It loses value over time.
And it should because the option position will be less valuable when it is closer to its expiration.
Why Is The Synthetic Position Not Exactly Like The Stock Position?
The option position is affected by time decay and the risk-free interest rate.
There are other differences due to the fluctuations between the call and put option prices and their wider bid/ask spreads.
They potentially can have other effects, such as implied volatility changes and put-call skew.
The option position has the advantage of not needing as much capital such that the option investor can place extra money into U.S. Treasury Bills and earn risk-free interest.
But is the market going to give the option investor free money?
No.
This is why the option position has a negative theta.
That is why the option investor’s profit and loss, as shown on the risk graph, is less than the stock investor’s.
Look at the above numbers carefully.
When the stock price dropped, the option investor lost more than the stock investor on December 4.
The option investor made less on February 5 when the stock price rose.
What Happens To The Synthetic Stock Position At Expiration?
Using our example, if the NVDA price is $450 at expiration, the call option expires worthless. And we are obligated to buy 100 shares of NVDA at $500 per share.
We lose $50 per share (or a total of $5000) at expiration, plus the cost of the position of $640 or a loss of $5640.
If the price of NVDA is $550 at expiration, the short put expires worthless.
And we have the right to buy 100 shares at $500, making $50 per share (or $5000).
Net profit is $5000 minus the initial cost of $640, or $4360.
If the price of NVDA stayed exactly at $497.81, the call expires worthless.
And we lost $219 due to the short put.
Plus, lose an additional $640 from the initial debit.
So, if the stock did not move, the synthetic position would have a net loss of $859.
This doesn’t happen with a stock position.
This is the downside of the synthetic stock position with its time decay and negative theta.
Is the Synthetic Stock Position a Risk Reversal?
Yes, it is. It is an at-the-money risk reversal.
A risk reversal is a term that refers to an option position where an investor is long on one type of option and short on the opposite type.
In our example, the investor is long a call and short a put.
But a risk reversal can also be when an investor is short a call and long a put.
Conclusion
The synthetic stock position created by a long call and short put has similar profit/loss characteristics as a typical stock position.
By leveraging margin usage of certain account types, the position can be initiated with less capital than a traditional stock position.
The disadvantage of time decay and loss of any potential dividends offsets this apparent advantage of the synthetic option position.
Ultimately, the stock and synthetic options positions are more or less equivalent.
As the saying goes, it is “six of one, half a dozen of the other.”
I am continually amazed at how the market is unwilling to give a clear advantage to any one thing.
We hope you enjoyed this article on how to create a synthetic stock position.
If you have any questions, please send an email or leave a comment below.
Trade safe!
Disclaimer: The information above is for educational purposes only and should not be treated as investment advice. The strategy presented would not be suitable for investors who are not familiar with exchange traded options. Any readers interested in this strategy should do their own research and seek advice from a licensed financial adviser.

Original source: https://optionstradingiq.com/how-to-create-a-synthetic-stock-position/


