Today we’re doing an OptionStrat Review.
This is a web based software tool for analyzing option trades.
Let’s take a look at what all the fuss is about.
Contents
- Introduction
- Example Bull Put Spread
- OptionStrat as a Learning Tool
- Modeling the P&L
- Saving the Trade
- Flow Data
- FAQs
- Conclusion
Introduction
OptionStrat.com is an online options modeling tool that can be used by:
- beginner traders to learn about options
- experienced traders to model and track their trades
- advanced traders use flow data to see what the big players are trading
There are several levels of access. It is quite usable without a login.
By creating a free account, you have the ability to save your trades and track their P&L.
Then there are two different paid memberships.
The first is for the live options tools, and the other is for the live options flow data.
Example Bull Put Spread
There is no need to sign up to use OptionStrat as a learning tool.
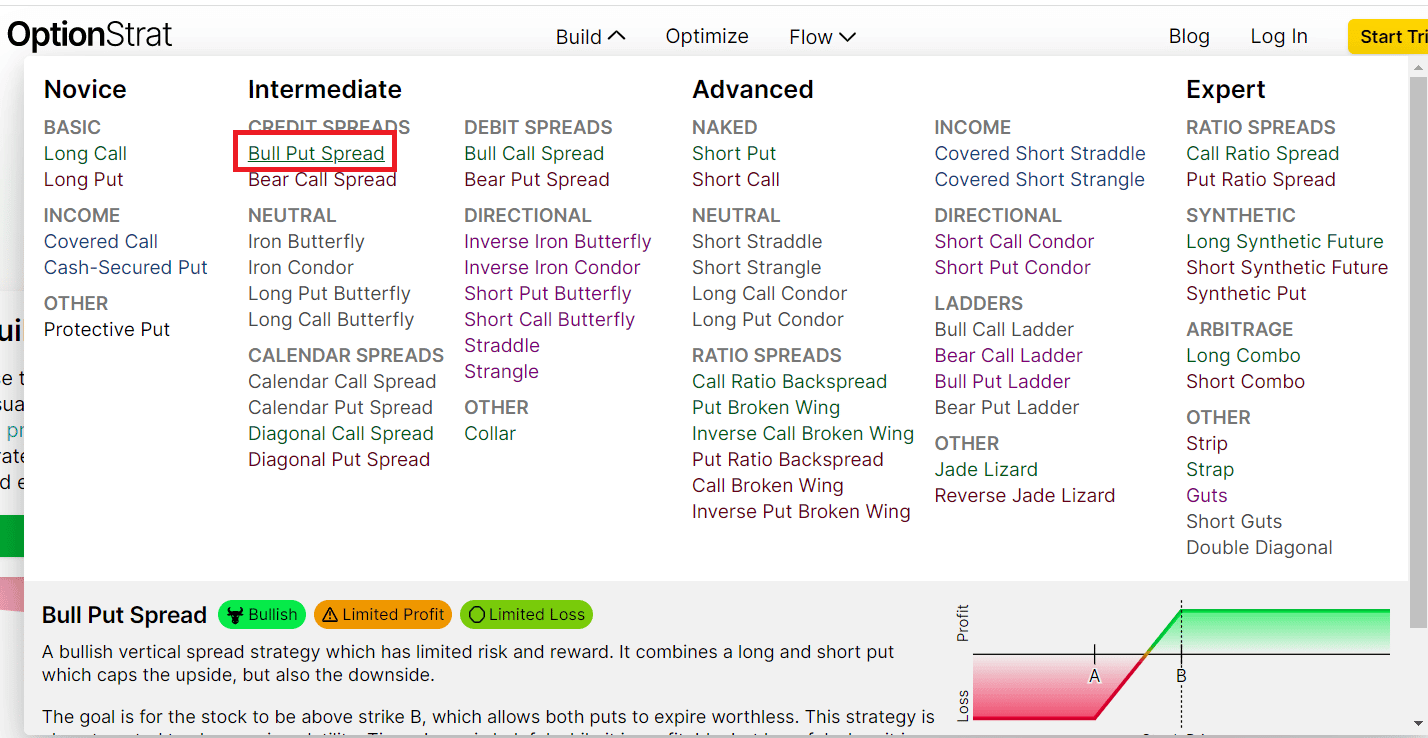
Just go to the Build menu, and you can see the many possible options and strategies you can learn about.
source: OptionStrat.com
As I hover over the “Bull Put Spread” strategy, I get a brief description of the strategy as well as a payoff graph.
Clicking on the link, I get an interactive payoff graph of an example bull put spread.
You don’t even have to construct it yourself.
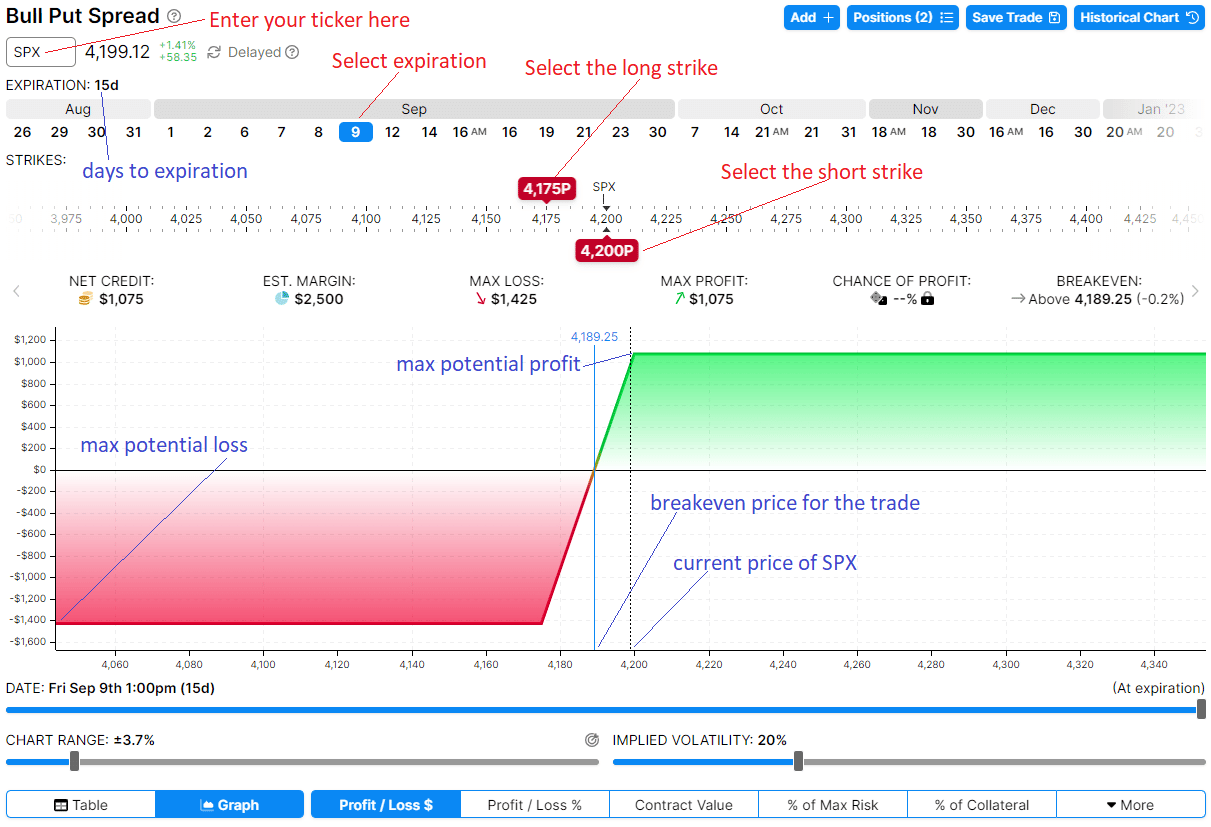
Of course, you can modify the trade by entering your ticker, changing the expiration date, and dragging the long and short strikes to your liking.
OptionStrat will give you information such as max potential loss and max potential gain at expiration.
The chance of profit calculation and the net position Greeks requires a paid membership.

Although the position Greeks can be calculated from the Greeks of the individual option legs if desired — see an example of such a calculation from a previous article,
the Greeks of the individual legs, as well as other info, can be seen by clicking on the strike price.
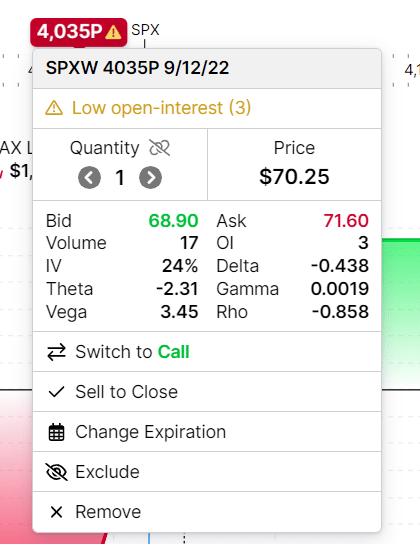
Here you can also change the option to another expiration, switch it from a put to call option, or increase the number of contracts.
By sliding the date slider below the graph, you can see the payoff graph on various days prior to expiration.
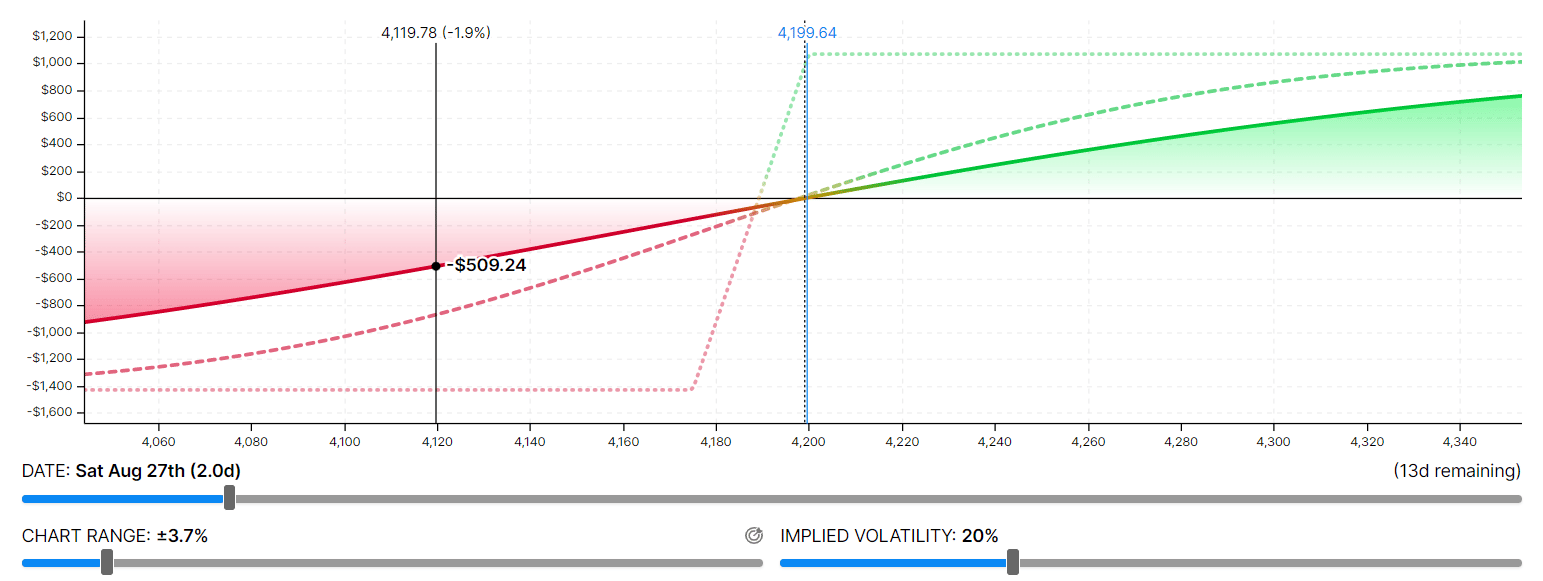
For example, it shows the graph two days into the trade with 13 days till expiration.
By adjusting the implied volatility slider, you can see how the graph changes as implied volatility increases or decreases.
You can also adjust the chart range with the corresponding slider in case any part of the graph falls off the view.
As I hover my mouse over the graph, I get calculated numbers of P&L (profit and loss) from the payoff graph.
Click on the Table view to see how much you would win or lose if SPX is at a certain price and at a certain time.
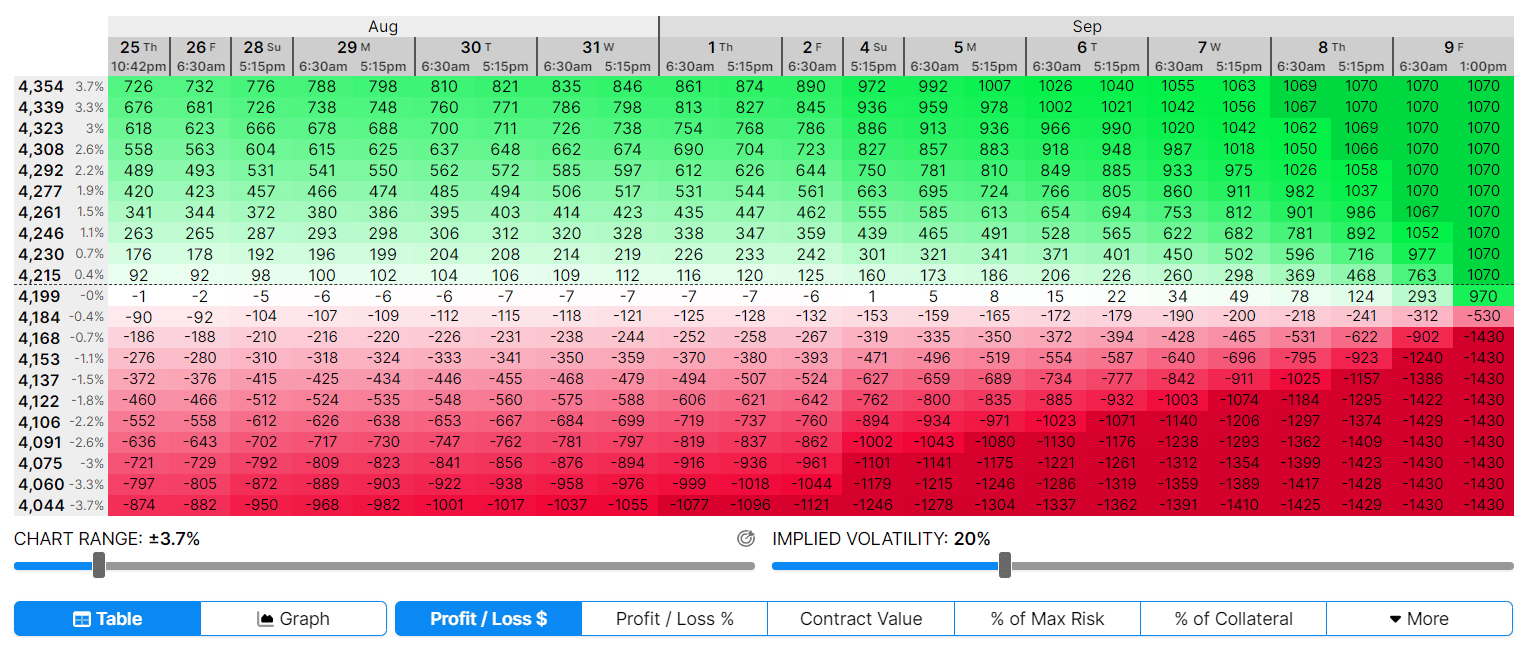
For example, this table shows that if SPX was at 4246 on Aug 26, your profit would be $265.
OptionStrat as a Learning Tool
Let’s say you are bullish on Honeywell stock (HON).
Put in “HON” on the Optimize tab and click “Bullish.”
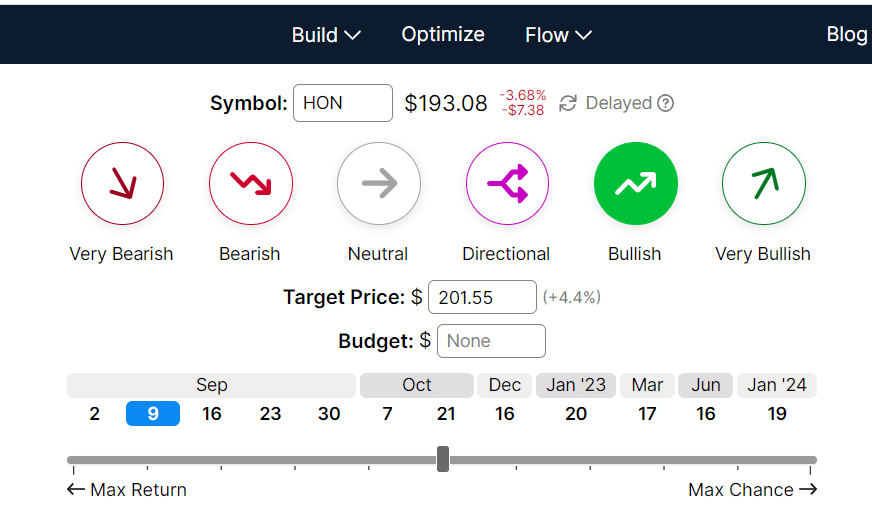
You would click on “very bullish” instead if you were very bullish.
OptionStrat gives you the possible strategies you can implement based on your sentiment.
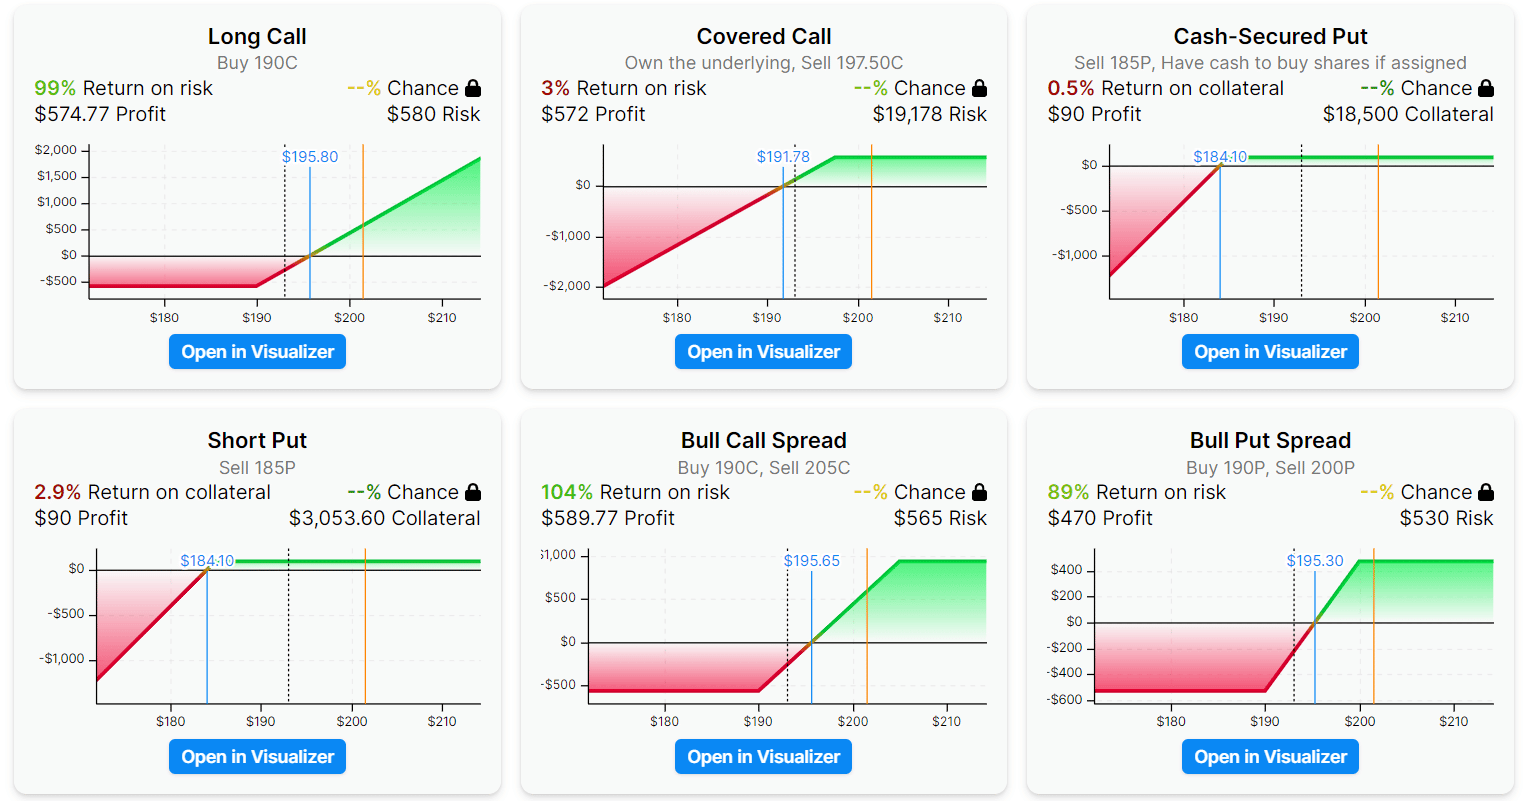
You can then explore, compare, and learn by using the Visualizer.
Modeling the P&L
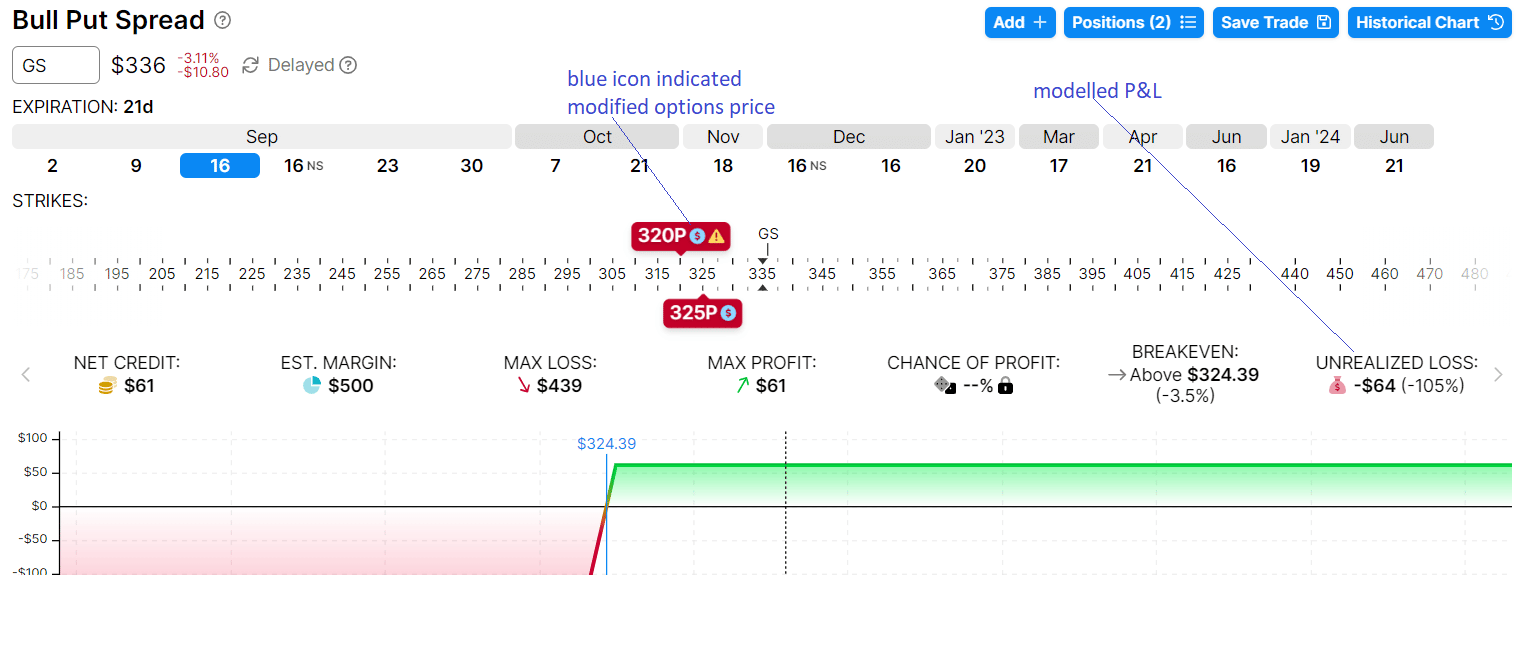
Let’s say that you had placed a bull put spread on Goldman Sachs (GS) several days ago in your brokerage account, which does not have all the options modeling features of OptionStrat.
We can enter that spread into OptionStrat:
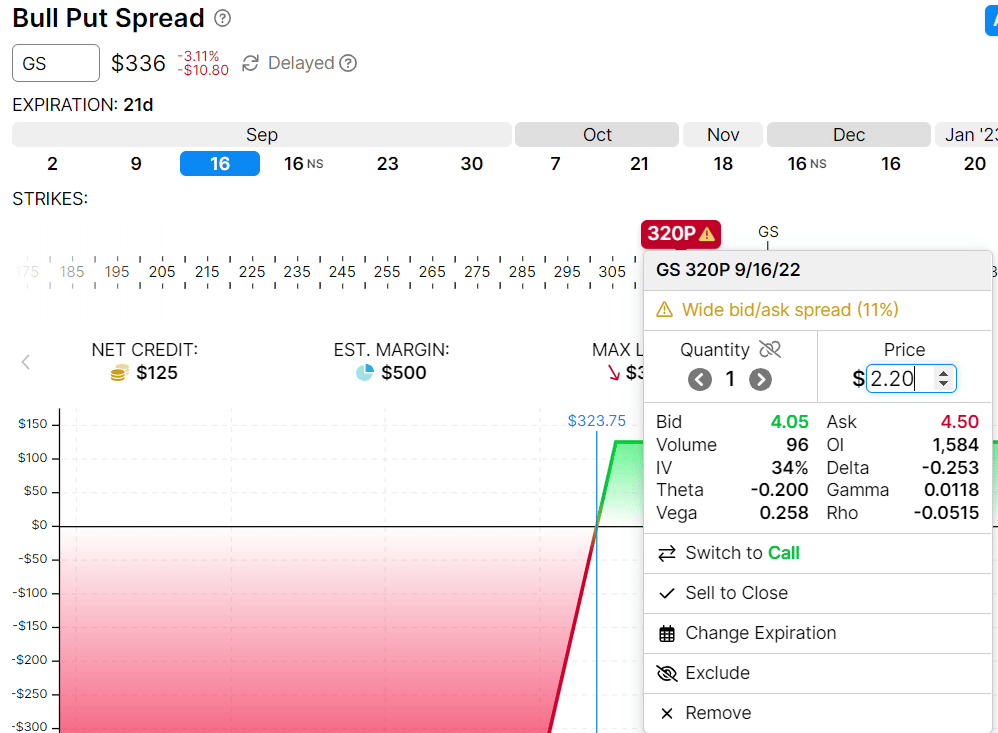
When we click on the strike price, we can enter the price at which we paid for the option or the cost of the option at the time we sold it.
By doing so, OptionStrat can calculate our current P&L using delayed options pricing data.
Saving the Trade
By creating a free account, you will be able to save your trades.
Just click on the “Save Trade” button and enter a title for the trade and description.
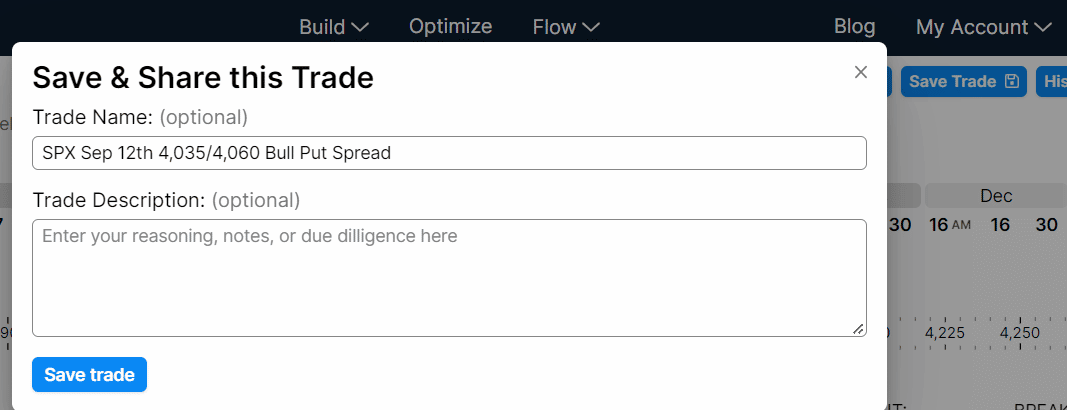
You can even share a link to your trade

Next time you log into your account, you can see your saved trades and current P&L based on delayed data.
Live data is available with paid membership.

For example, it shows that the trade is down by $64.
Now suppose sometime later, the price is going down (instead of up as we hoped). We adjusted to hedge against the loss by buying a put spread at later expiration.
We can add that adjustment to the trade in OptionStrat and put in the prices of our adjustment options.
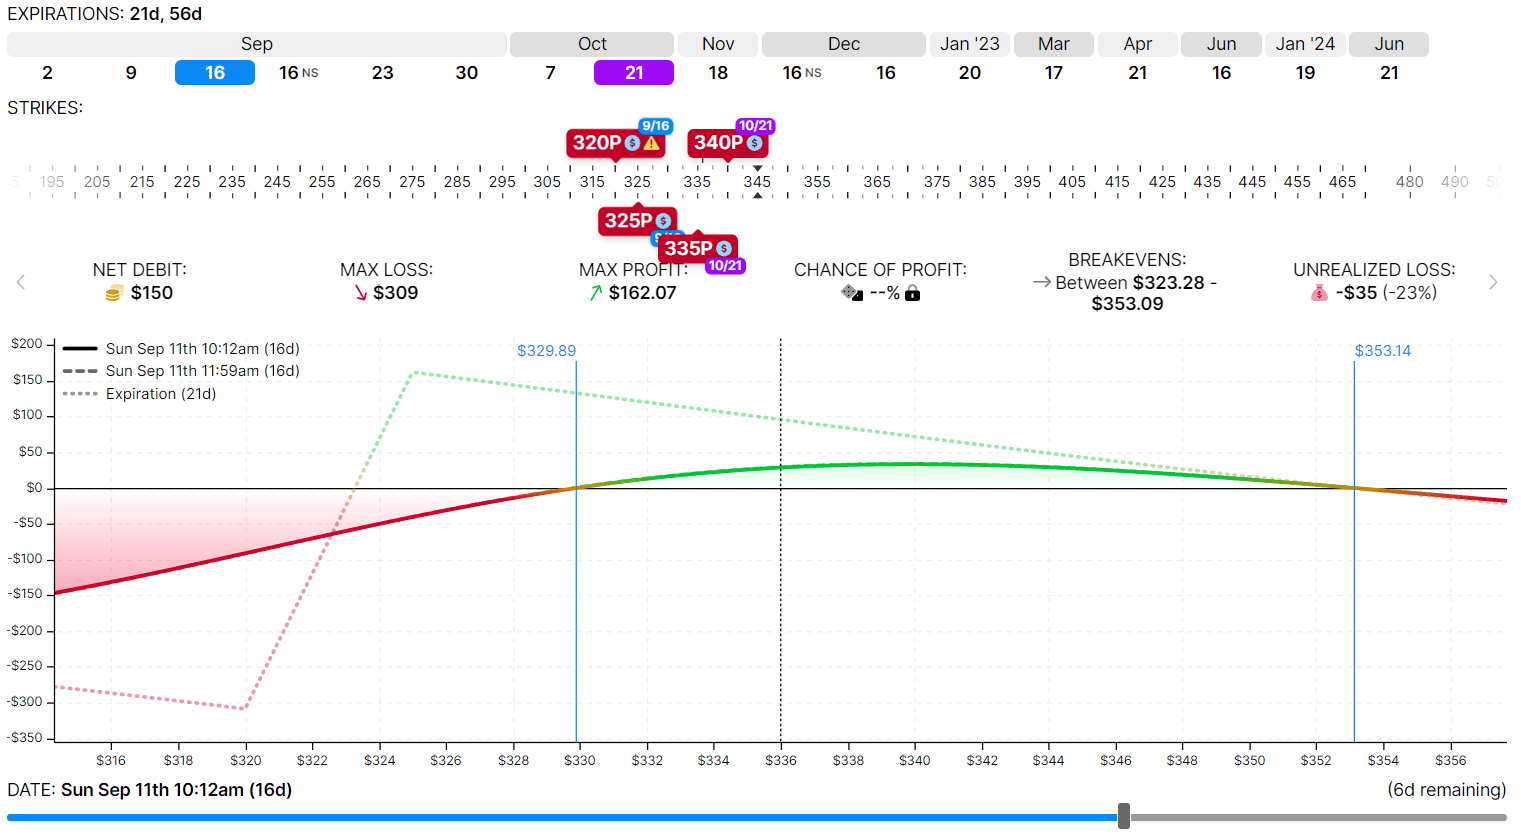
It will be able to track the P&L with the adjustment.
Flow Data
Under the Flow tab, you can see what tickers OptionStrat thinks are bullish and bearish based on flow data.
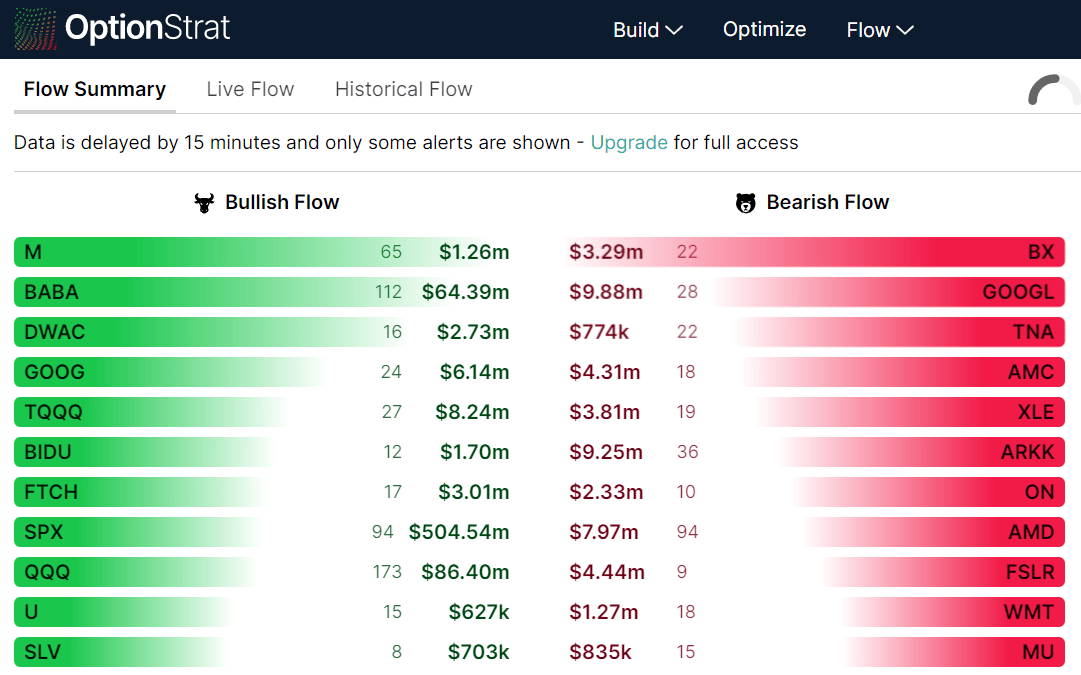
OptionStrat scans for large and unusual trades.
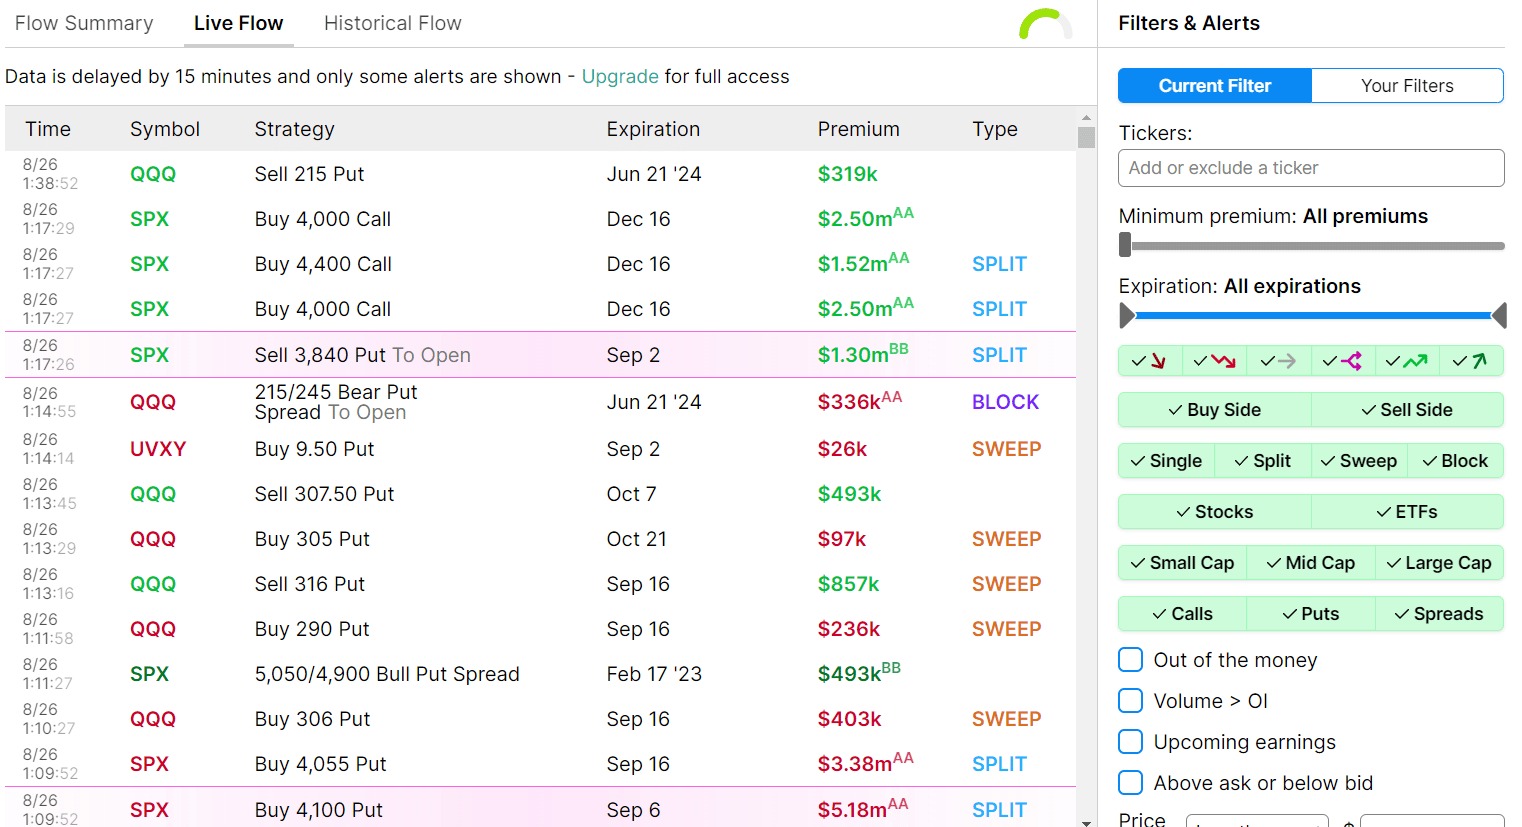
Unless you have paid membership, what you see here are only sample excerpts and using delayed data.
FAQs
What else do you get with the Live Option Tools membership?
The main feature is live data. In addition, you get the display of additional information such as:
- the net Greeks of a multi-leg position
- visual overlay of the volume of each strike
- chart of implied volatility
- chart of your P&L of your tracked trades
- display of market events such as earnings
- chance of profit calculation
- and a few others
AA means that the trade was filled “above the ask.” BB means “below the bid.”
This is one of the ways OptionStrat determines the urgency of a trade it sees.
Conclusion
OptionStrat is a neat tool.
The user interface is modern, well thought out, and relatively easy to use.
If you are talking trades with a friend, the “share link” feature is a handy way to convey all the information about your trade with just a link.
Some investors find that once they make an adjustment to a complex options spread trade, they need to resort to a spreadsheet to track their final P&L.
While not as robust as a spreadsheet, see if OptionStrat’s saved trades feature can do the job for you.
If you are fine with 15-minute delayed data, this feature is free.
For those looking for options modeling software OptionStrat is something worth considering.
Trade safe!
Disclaimer: The information above is for educational purposes only and should not be treated as investment advice. The strategy presented would not be suitable for investors who are not familiar with exchange traded options. Any readers interested in this strategy should do their own research and seek advice from a licensed financial adviser.

Original source: https://optionstradingiq.com/optionstrat-review/

