Candlestick patterns are an important part of day trading and investing. A single candlestick pattern can give more details about whether the bullish trend will continue or whether a reversal is about to happen.
There are many candlestick patterns, including hammer, bullish engulfing, and doji. In this article, we will look at the pin bar and explain how to use it.
Understand Candlesticks
For starters, a candlestick is made up of two main parts. First, there are shadows, which are the thin lines that happen below and above the body.
In a bullish candle, the upper side of the candlestick pattern is usually the highest price during a session while the lower part is the lowest price during the session. Similarly, during a bearish candlestick, the lower part is the lowest point of the session and vice versa.
Related » How Relevant Are the Highs and Lows in Trading?
A body, on the other hand, refers to the block between the upper and lower sides of the shadows. In a bullish candle, the lower side is known as the open while the upper side is the closing price. Similarly, in a bearish candle, the upper side is the open while the lower side is the close.
It is worth noting that some candles don’t have an upper and lower shadow (like marubozu). This usually implies that the open price was the highest point while the closing price was the lowest point.
What is a pin bar?
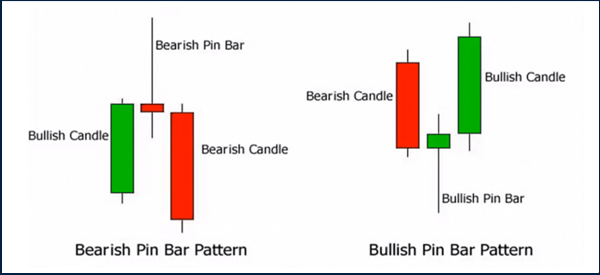
A pin bar is a single-bar candlestick that is made up of a small body and a long upper or lower shadow. In most cases, the bar is formed between a bullish and bearish candlestick. When this happens, it is usually a bearish pin bar pattern.
On the other hand, it happens between a large bearish and large bullish candlesticks. The chart below shows how a bullish and bearish pin bar pattern looks like.

How to spot a pin bar pattern
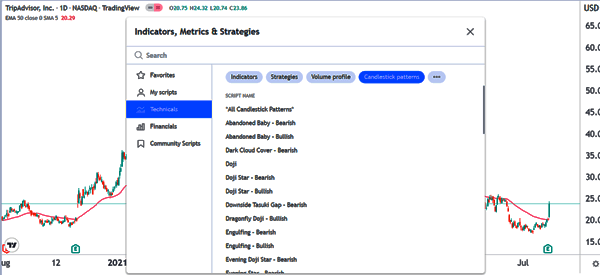
An easy way to spot a pin bar pattern is to first know what it looks like. Next, one of the easiest strategies to use is to use TradingView’s indicator tab and select all candlestick patterns. When you do this, the indicator will scan the chart and identify all candlestick patterns in it.

However, it is worth noting that the tool is not accurate. Instead, it should be used as a starting period for this analysis.
Another approach is to use visual analysis to find the pin bar pattern. This is where you just look at the chart and identify it easily. As you do this, there is a possibility that you will also spot other chart patterns in the chart.
Most importantly, you should do a multi-timeframe analysis to ensure that you get a bigger picture about the situation.
It is also worth noting that a situation known as a double pin bar can happen. This is a situation where the initial pin bar pattern is followed by another pin bar.
What does a pin bar tell traders
In price action analysis, chart and candlestick patterns usually send two main pictures about the market.
First, there are continuation candles that send a picture that an asset’s price will continue moving in the existing direction. A good example of a continuation pattern is the three white soldiers pattern. When it forms, it usually sends a sign that the bullish trend will go on.
Second, there are reversal patterns that send a picture that a new trend is about to emerge. Examples of popular reversal candlestick patterns are hammer, doji, and morning and evening star.
A pin bar usually sends a message that a reversal may be about to form in the market.
Pin Bar trading strategies
Contrarian approach
A common pin bar trading strategy is the contrarian one. This one refers to a situation where a trader assumes that the original trend will continue. As a result, instead of opening a reversal trade, they go in the opposite direction.
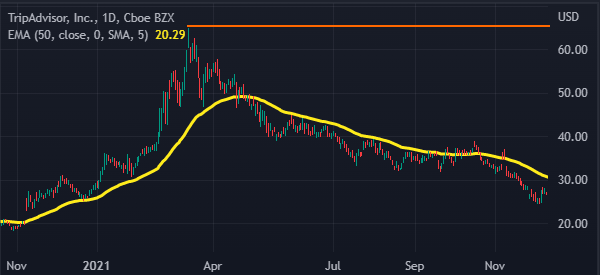
To mitigate risks, they approach this situation using pending orders. In this case, in case of a bearish pin bar, they usually set a buy-stop above the upper shadow. If the view is correct, the bullish trade will be initiated.
A good example of this is in the chart below. A trader would have placed a buy-stop at $65.47. If the bearish set-up was invalidated, the trade will then be initiated.

Reversal
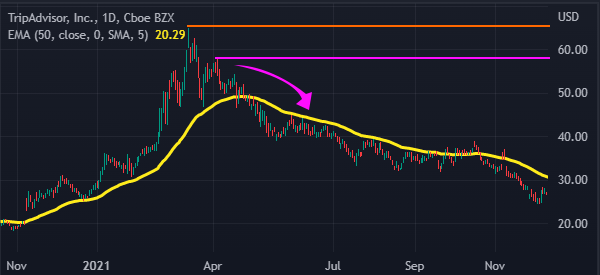
As mentioned above, the pin bar candlestick is usually a reversal sign. As a result, when it forms, it usually sends a sign that the asset will move in the opposite direction. Therefore, the easiest approach is to open a trade in the opposite direction and then set a stop-loss at the upper side of the pin bar.
A good example of this is shown in the chart below. In this case, a trader would have set a sell-stop at $57.69 and a stop-loss at $64.90.
In this case, the sell-stop will be triggered if the pin bar pattern is confirmed. At the same time, the stop-loss will help to protect you if the pattern is not triggered.

Combining with other patterns
Another approach of using the pin bar pattern is to combine it with other chart patterns and technical indicators.
For example, in the case of the pin bar shown above, you could add a moving average on the chart. In this case, a more bearish chart pattern will be confirmed if the price manages to move below the moving average.
Similarly, you could use the indicator like the Relative Strength Index (RSI). If the pin bar pattern forms in a period when the Relative Strength Index (RSI) is at an overbought level, it is a sign that a new bearish trend will happen.
Summary
The pin bar pattern is a useful reversal pattern that can be used by both traders and investors. It is not a popular chart pattern in the market. Still, using the three strategies mentioned above will help you be more successful in it.
External useful resources
- The pin bar: One of the most powerful price patterns in forex trading – Forex Traders


