In today’s market environment, higher inflation and interest rates have left investors searching for safe, reliable sources of yield.
One option to consider is fixed-income investments, such as T-bills, which can provide a predictable return.
But what if you could combine the safety of T-bills with the potential for higher returns offered by options strategies?
By employing a carefully constructed options strategy, it’s possible to achieve a portfolio with zero risk – something that many investors strive for.
In this article, we’ll explore the concept of using T-bills in conjunction with options strategies to create a truly diversified, risk-free portfolio.
We’ll take a deep dive into the specifics of this approach and provide practical examples of how it can be put into action. So, let’s get started!
Contents
- Risk-Free Option Strategy
- Long Call
- Asymmetrical Risk Profile
- Theoretical Risk Versus Realized Risk
- Put Debit Spread
- Calendar
- Iron Condor
- Combination Of Strategies
- FAQs
- Conclusion
Risk-Free Option Strategy
As of early 2023, the U.S. Treasury Bill rate of return sits at an impressive 5% annualized rate.
While this return isn’t immediately realized, with the bill’s maturity date dictating when the return is received, it still presents a compelling investment opportunity.
For example, let’s assume an investor with a $100,000 portfolio purchases T-bills and earns a guaranteed credit of $5,000 at maturity.
With this guaranteed return, it’s possible to deploy options strategies with a maximum aggregate risk of $5,000 and still maintain a portfolio value of at least $100,000.
This approach effectively creates a risk-free options strategy, as the T-bills provide a solid foundation of guaranteed returns that can offset any potential losses incurred through options trading.
So, let’s dive in to some examples.
Long Call
One of the simplest options strategies is the Long Call, which offers a limited risk for buyers.
The maximum amount of risk in this strategy is equal to the debit paid for the option.
Taking a real-life example, suppose an investor is bullish on the overall market on January 10, 2023, because the SPY (the S&P 500 ETF) daily chart looks like it is breaking out of a consolidation range:
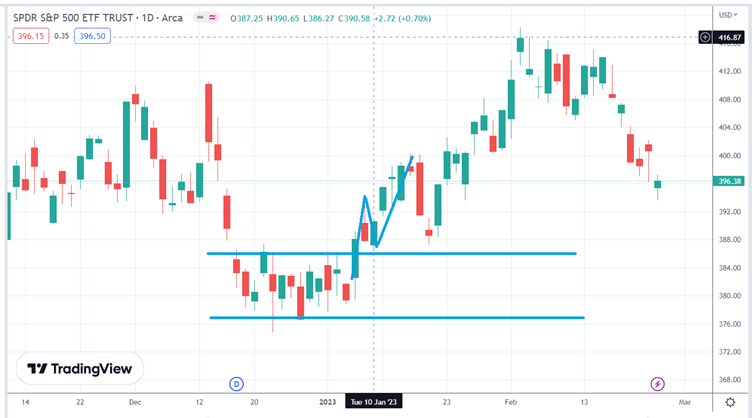
source: TradingView.com
The investor can buy one call option on SPY with an expiration of February 17 (which is 38 days out in time).
With SPY at $387, the investor can buy one contract of the $390 call option for a debit of $1000. The debit is the maximum loss.
Even if the call option becomes completely worthless at expiration, the most the investor can lose is the $1000 that he paid.
Obviously, that is not the goal.
The goal is for the investor to sell back the call option before expiration at a higher price than what was paid.
Suppose the investor decided to sell the call option on January 17 when the first red candle appeared.
That call option near the end of the market day on January 17 would be worth $1444.
That is a $444 profit on a risk of $1000, or a 44% return on risk.
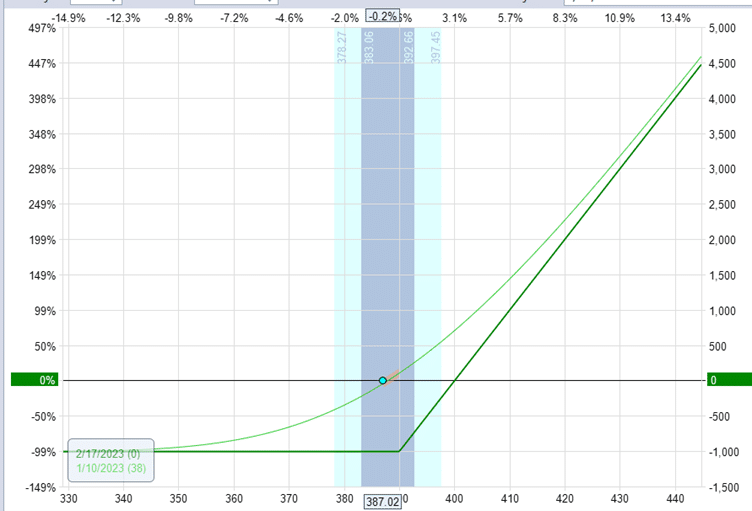
The payoff diagram of the long call looks like this:
source: OptionNet Explorer
As you can see, there is no price that SPY can go where the investor can lose more than $1000. The risk is limited.
The reward, however, is unlimited.
By getting the direction correct, selling the call option after holding it for a week gave the investor a 44% return.
If the investor had gotten the direction wrong, they should get out fast.
In this case, the investor got the direction correct.
When that is the case, then the investor can hold the option longer to see if additional gains can be achieved.
For example, if the option was held until February 9, the call option would be worth $1888 — an 89% return.
I got these numbers by going back in time using OptionNet Explorer and looking at the historical option prices.
I did not read the numbers of the risk graph because the actual numbers will differ due to other factors, such as implied volatility changes.
Asymmetrical Risk Profile
The long call has an asymmetrical risk profile — the potential reward is larger than the potential risk.
Suppose SPY moves up 5 points the next day to a price of $392. Reading the numbers off of the T+0 line (which will be a close enough approximation), the win profit would be $246.
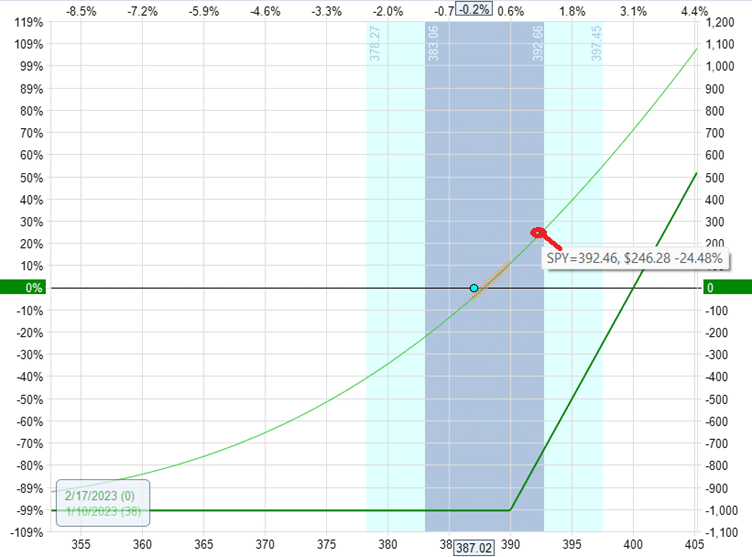
Suppose SPY moves had moved 5 points down to a price of $382 instead; the loss would be –$232.
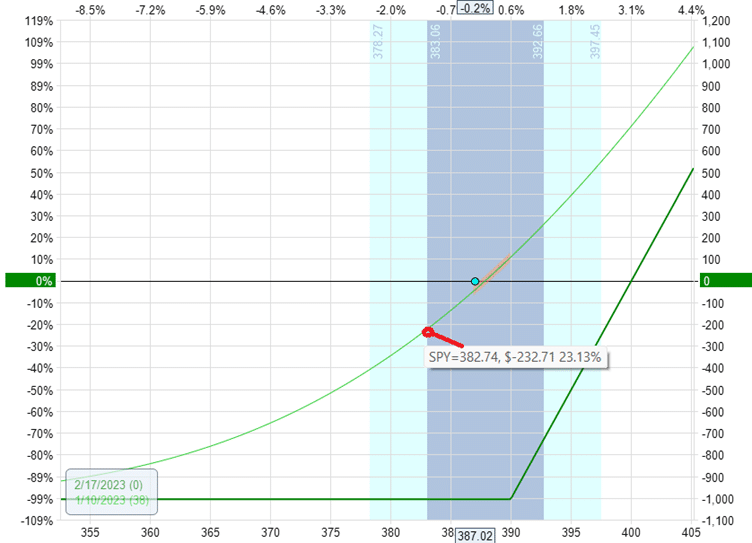
See how the loss is smaller than the win for an equal size move in either direction.
While the edge is small, it is nevertheless an edge.
We also need to ensure that time decay does not erode this edge.
Just look at the expiration graph, which shows the P&L at various SPY prices at expiration.
What would your P&L be if SPY was at $392 at expiration?
What would your P&L be if SPY was at $382 at expiration?
They would both be losses.
You would lose money even if SPY went up as expected.
This is because by holding the option for so long, the time decay of negative theta has eroded any profits that one would have made from getting the direction correct.
Theoretical Risk Versus Realized Risk
One of the downsides of buying a call option is the negative theta.
In our example, the call option starts with -15 theta.
This means that if the price did not move and just stayed at $387, the option value would have decayed to zero at expiration, and the entire $1000 of invested capital would be lost.
Most investors who buy a long call will not hold it to expiration.
They may have the plan to exit the trade if the call option has lost 50% of its value. Or perhaps 25% of its value, whatever it may be.
If they have such a plan and stick to that plan and monitor the P&L actively, the maximum loss of $1000 should not occur.
Assuming that they adopt the 50% loss rule, they would exit our example if they see a loss exceeding $500.
They might lose up to $600 due to overnight gaps beyond their control, slippage, not being able to be at the computer, etc.
The $600 loss would be the actual realized maximum loss, whereas the $1000 would be the theoretical maximum loss.
In a portfolio where there is only $5000 of “house money” to play with, one would not want to have a trade that can lose $1000. So adoption of the 50% rule might be wise.
Why?
Imagine if the investor has five such trades active at the same time.
Or imagine if the investor plays one trade, then plays another trade, and plays five trades in sequence.
Either way, if all five trades happen to be losers, the investor would have lost $5000.
If that occurs, there is no more “free money” to play with.
Any additional trades would risk the original $100,000, and you no longer have a risk-free portfolio.
To maintain the risk-free portfolio, the investor would have to buy more T-bills and wait a year to maturity to receive another $5000 credit before placing another trade.
What are the chances that one would get five losing trades in a row?
You ask.
Suppose the investor can pick the direction correctly 50% of the time (I know, just suppose). Suppose a coin is flipped, and heads win, and tails lose.
What are the chances that the coin will get five tails in a row?
This is essentially the question that you are asking.
Going back to statistics class, the answer is that there is a 3.125% chance of occurrence.
The answer is calculated by taking ½ times ½ times ½ times ½ times ½, which is 1/32. There is one out of 32 chance of this occurring.
Statistically speaking, five tails in a row would occur after 32 throws of the coin.
So you would see this cluster of losses after making 32 trades (assuming your win rate is 50%).
Without getting bogged down with all these details, the moral of the story is that traders that successfully utilize long call and long put options are:
1. Able to read price action or have a system using indicators where they can get a better than 50% win rate in predicting direction. Increasing the win rate will make the cluster of 5 losses less frequent.
2. Able to cut their losers fast and hold onto their winners for larger gains so that the average win is larger than the average loss. Doing so can make them profitable even if only 50% of the trades are winners.
3. Getting out of their trades fast enough so that they have the edge of the asymmetric risk profile and are less affected by time decay.
In this way, they can make enough profits in the 32 trades prior so that they can survive the string of 5 losses that might occur.
Put Debit Spread
One way to mitigate the negative effects of theta decay is to use a debit spread instead of a long option.
Suppose an investor is bearish on GLD (gold ETF) on February 9, 2023.
The investor can buy five contracts of a put debit spread:
Date: February 9, 2023
Price: GLD @ $173
Buy five March 17 GLD $172 put @ $2.30
Sell five March 17 GLD $170 put @ $1.59
Net debit: –$358
Max Risk: $358
Max Reward: $642
Here the net theta at the start of the trade is only -0.44, much smaller than that of a long call or put.
The risk graph also shows an asymmetric risk profile:
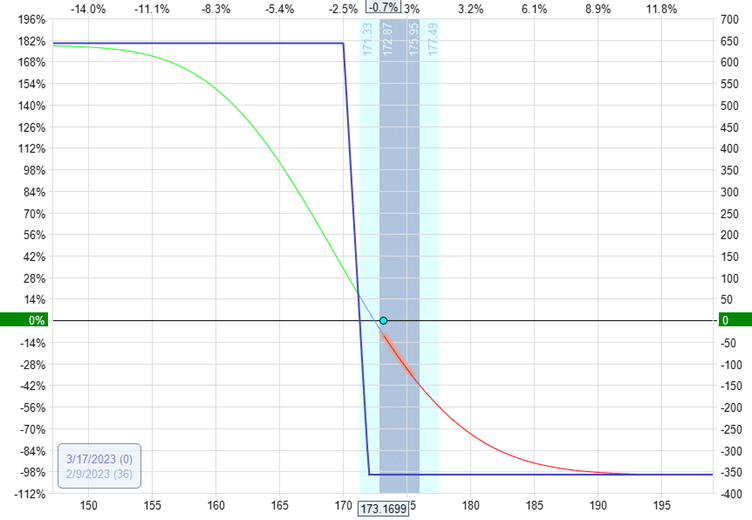
The potential reward is greater than the max risk.
In this trade, the most that we can lose is $358.
But we can potentially make $642 in profits.
If the investor decides to sell the spread on February 23, the investor would have made $220 on a risk of $358. That is a 61% return.
Calendar
You can buy an at-the-money calendar if you don’t want to choose a direction but think the price will stay within a small range.
Date: October 17, 2022
Price: GOOGL @ $100
Sell ten Nov 4 GOOGL $100 put @ $4.30
Buy ten November 11 GOOGL $100 put @ $4.75
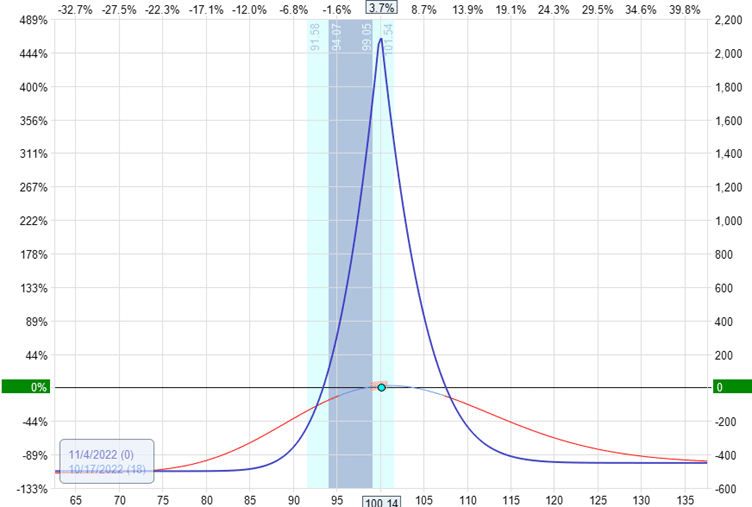
Net debit: $450
The cost of the calendar of $450 is the max risk, as can be seen on the risk graph:
Iron Condor
Okay, I know not everyone is a time-spread calendar trader.
And some of you may not be used to buying options.
Suppose you are an option seller. You like to sell options.
You are a “positive theta” trader and like to get time decay on your side.
Suppose iron condors are your favorite trade because you dislike picking directions.
No problem. Here is an iron condor on Starbucks where we are risking $400 to make $100 potentially:
Date: January 5, 2023
Price: SBUX @ $104
Buy one February 17 SBUX $85 put @ $0.47
Sell one February 17 SBUX $90 put @ $0.87
Sell one February 17 SBUX $115 call @ $0.95
Buy one February 17 SBUX $120 call @ $39
Net credit: $96.50
Max risk: $403.50
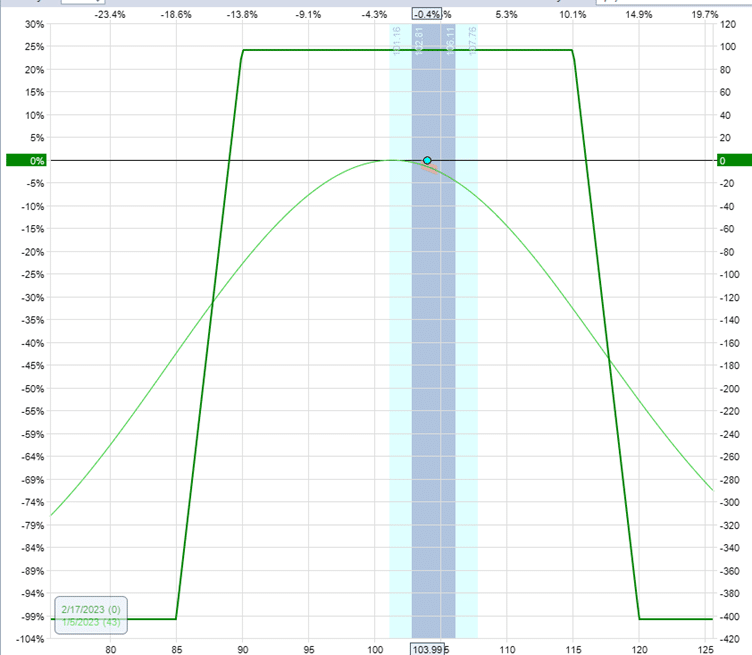
We are getting a credit of $100.
The maximum theoretical loss on the trade is $400.
An investor might have a common plan to collect 50% of the available credit and exit the trade if the loss is greater than twice the credit received.
That would mean a target profit of $50 and an exit trigger with a loss of $200.
Adding some buffer, we can say that this condor would have a realized maximum potential loss of $300 rather than the theoretical loss of $400.
By doing so, we are reducing the risk and hence can trade more contracts or trade more condors in other underlying.
Indeed, your broker will still allocate a margin of $400 for this trade.
With a $100,000 portfolio, that would be no problem at all.
Combination Of Strategies
With an extra $5,000 to trade with, it is possible to employ a combination of strategies.
An example portfolio might consist of,
- A long option with a maximum risk of $1000
- A debit spread with a maximum risk of $360
- A calendar with a maximum risk of $450
- An iron condor with a maximum risk of $400
And there would still be money left over to trade a couple more iron condors and butterflies into the mix.
As long as the aggregate risk does not exceed $5,000, you keep the $100,000 safe.
Once some of the trades start taking some losses, the $5,000 might draw down to a lesser amount.
To maintain a risk-free portfolio, one must check the maximum potential loss of each new trade to ensure that the risk does not touch the $100,000 based on the balance remaining in the account.
FAQs
What are T-bills?
T-bills or Treasury bills are U.S. government issues bonds. T-bills are short-term assets with varying maturities from one month to a year. The consumer is lending money to the U.S. government.
Some T-bills do not yield interest. Instead, they are sold at a discount to their redemption price at maturity.
How do we buy T-bills?
You can buy T=bills directly from the U.S. government at TreasuryDirect via an auction process.
Or you can buy it through your brokerage account by looking for “fixed income” and/or “bonds.”
The yield might be slightly lower, but one would get the convenience of buying through the broker.
Are T-bills really risk-free?
Yes, T-bills are considered an investment with zero risk of loss — at least, they are the closest investment possible to being risk-free.
Whenever the financial industry speaks of a “risk-free rate of return,” they typically use the rate of return of T-bills in their calculations.
For those who believe that there is no such thing as absolutes, then they would say that there is nothing that is completely 100% risk-free.
They are correct because the Federal government can default on its loan.
While that is possible, the federal government has never defaulted on its obligation to T-bills.
And it is generally believed that they never will. Most investors of T-bills can sleep easy that they will not lose their investment.
The risk of T-bills is certainly less than the risk of inflation decaying the value of money sitting in cash.
Conclusion
Fixed-income securities have traditionally been overlooked by many investors due to their low yields.
However, recent government interest rate hikes have caused these yields to rise significantly, making them a viable option for investment strategies.
One notable advantage of fixed-income securities is their low risk, making them attractive to investors seeking stable returns.
By combining these assets with options strategies, investors can potentially boost their overall returns.
With careful planning and execution, investors can leverage these securities to achieve their investment goals while minimizing risk.
We hope you enjoyed this article about our risk free option strategy.
If you have any questions, please send an email or leave a comment below.
Trade safe!
Disclaimer: The information above is for educational purposes only and should not be treated as investment advice. The strategy presented would not be suitable for investors who are not familiar with exchange traded options. Any readers interested in this strategy should do their own research and seek advice from a licensed financial adviser.

Original source: https://optionstradingiq.com/risk-free-option-strategy/


