Selling weekly covered calls or monthly covered calls. Which is better?
The monthly covered call writers say you get more premium selling a monthly call than a weekly one.
The weekly covered call writers argue that you get more credit by selling four weekly covered calls than by selling one monthly covered call.
They both are correct.
The monthly covered call writers say that the sweet spot on the option decay curve is from 45 days to 21 days to expiration.
The weekly covered call writers would then say this does not make sense because you get the greatest option decay during the last week before expiration.
The monthly covered call writers would then point out that the decay acceleration during the last week only occurs with at-the-money options.
It is not exactly true with out-of-the-money options.
In fact, they tend to hold their value the last week and don’t decay as much as one might expect.
Contents
- Introduction
- Weekly Covered Calls Backtest Year 2021
- Backtest During Year 2022
- Conclusion
Introduction
One way to settle this argument is with a scientific study.
But then, depending on which side the study turns out to favor, the other side would say, “It happens that during the years of the study, the market conditions were such that it favored weekly or monthly options.
But if you do it on such and such years instead, you will see that the other side would win out.”
The debate has not concluded because I still see investors on both sides, some selling weeklies and others selling monthlies.
Perhaps, it does not make a difference at all.
Both can be profitable depending on how the trade is managed.
It depends on how active a role the investor wants to play.
Weeklies require greater monitoring and more frequent management of the trades.
But can respond to changes in market conditions more quickly.
Monthlies can be more passive and longer-term investments.
Managing the trade includes knowing when and when not to put on the trade.
The covered call is a bullish trade regardless of whether it is done with weeklies or monthlies or whether it is an out-of-the-money or in-the-money covered call.
It is true that out-of-the-money-covered calls are more bullish than in-the-money-covered calls.
And at-the-money covered calls are in between the two.
Nevertheless, even with in-the-money covered calls, you want the underlying price to go up and the stock to be called away.
If we had a crystal ball and initiated a covered call when we saw that price was going to go up in the future, then we could be profitable regardless of whether we are using weeklies or monthlies.
Since we don’t have a crystal ball, you have to make that determination, just your favorite indicator or technical analysis.
Weekly Covered Calls Backtest Year 2021
For our weekly covered call strategy backtest, we are using the 20-day simple moving average in combination with the MACD indicator.
We will use IWM (Russell 2000 ETF) as the underlying asset being tested for the year 2021.
Here are the rules used in this backtest.
Every Monday (or Tuesday if Monday is a holiday), check the trigger condition one hour after the market open.
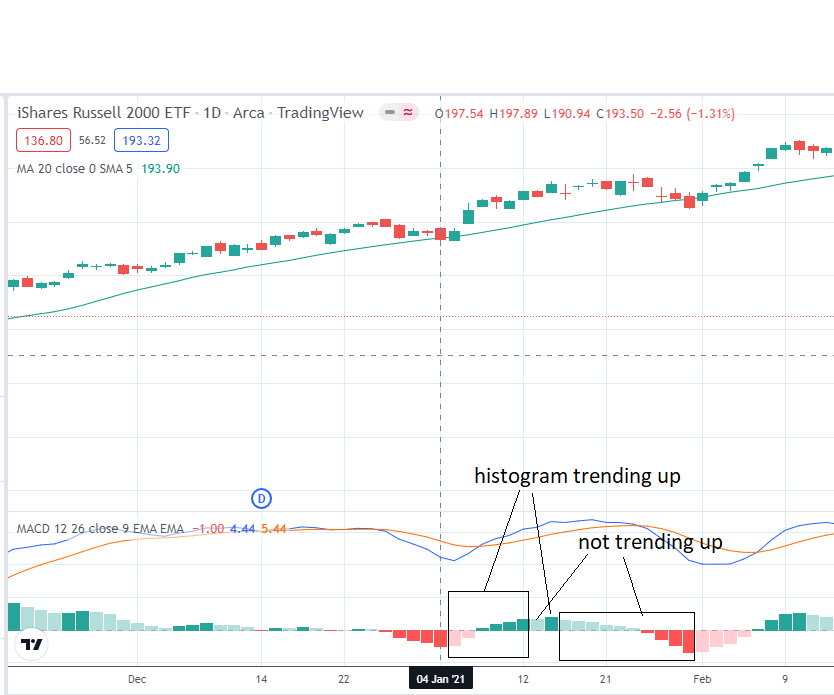
The trigger condition is when the 20-day simple moving average is sloping upward, and the MACD histogram is trending upward.
When viewed on TradingView.com, the trending up histogram means that the MACD histogram is in light red color or dark green color.
source: tradingview.com
Note that when the histogram is in those colors, the histogram is higher than the day before.
The histogram bars that are in dark red and light green are indications of the histogram trending down.
On January 4, 2022, the 20-day moving average was sloping up (see the above screenshot), but the MACD histogram was still the dark red color (not trending up).
Therefore, no trigger and no trade.
On January 11, the 20-day moving average is still sloping up, and now, the MACD histogram is dark green.
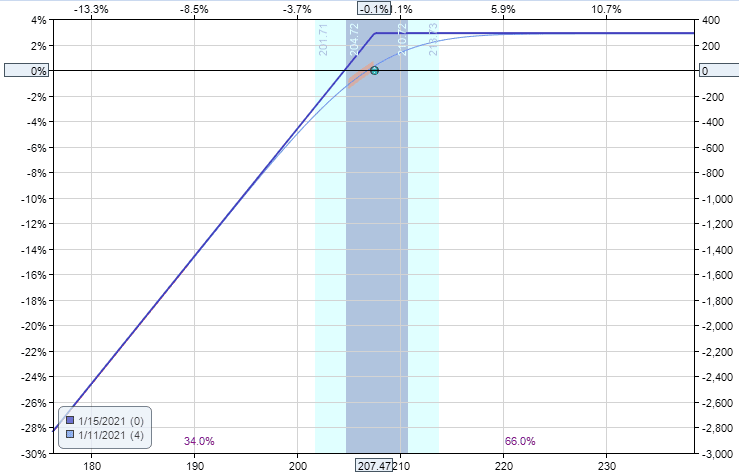
That is a trigger, and we initiate the covered call on Monday (one hour after the market opens) by buying 100 shares of IWM and selling an ATM call with a strike of $207.5 for the coming Friday expiration.
Trade Details
Date: January 11, 2021
Price: IWM at $207.47
Buy 100 shares of IWM @ $207.45
Sell the Jan 15 IWM $207.5 call @ $287
Net Debit: $20,460
source: OptionNet Explorer
We will hold the trade until the expiration of the short call. If the price of IWM is above the strike price, our 100 shares will be called away.
Otherwise, the call option will expire worthless.
On expiration, on January 15, the price of IWM is $210.75. So 100 shares of IWM are called away. In other words, we are obligated to sell 100 shares of IWM at $207.50/share at expiration.
We know that this first covered call was profitable simply because the “stock” was called away.
Technically, IWM is an ETF.
But we will just use the more generic term “stock.”
You walk away with a profit whenever a stock is called away in a covered call.
How much profit? $290.

We repeat the process the following Monday.
If the trigger condition is met, we sell another ATM call.
If at the time, we don’t already have 100 shares of IWM, we buy 100 shares to make it a covered call.
When the trigger condition is not met, we do not sell the call option.
If we still have 100 shares of IWM, we liquidate (or sell) those shares.
We manually performed this exercise using historical data from OptionNet Explorer for the entire year 2021, and here are the results:
OptionNet Explorer Back Test Results
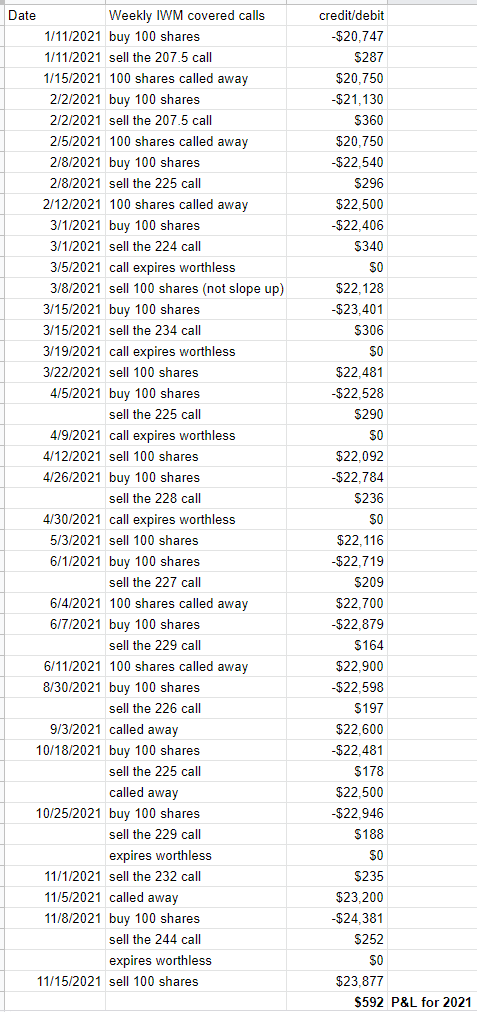
The weekly covered call was profitable to the amount of $592.
Since the capital used to buy 100 shares of IWM is about $22,500, the return yield is about $592/$22,500 = 2.6% for the year.
In terms of percentage return, this is not great.
The yields are low due to the high capital requirement of the covered call strategy.
Perhaps the yield would have been better if we had used out-of-the-money covered calls.
Or perhaps not. Who knows.
It will depend on what the market does.
Using an out-of-the-money covered call would have captured more of IWM’s capital appreciation in a bull market.
But it would have also created a greater drawdown if IWM went bearish.
Backtest During Year 2022
Those playing devil’s advocate will say that, of course, we are going to get a positive return because we’ve picked a bullish year to run the study on.
That is a good point.
So, we will run the same rules in the year 2022.
While at the time of this writing, we have gone through only nine months of the year, it looks like a bearish year.
Here are the results for the first nine months of 2022.
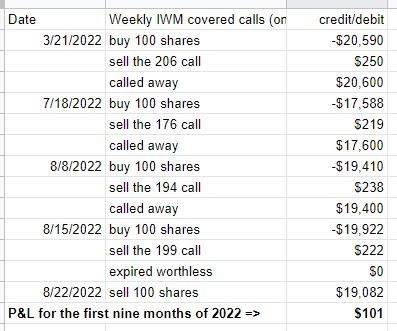
Positive P&L of $101 for the first nine months of the year 2022.
Our condition was only triggered four times in the nine months.
It is our trigger condition that kept us out of the market when conditions were not ideal for covered calls.
If we had blindly performed a weekly covered call every single week of 2022, we would have ended up with a negative P&L., And it wouldn’t have mattered if it was an in-the-money covered call or out-of-the-money covered call.
Personally, I rather have a system that keeps me from losing money, even if it means having fewer trades.
It doesn’t necessarily mean you have to have fewer trades; you just need to search more underlyings to find one that meets the trigger condition.
You don’t have to use IWM every week.
Those with larger accounts can use SPY. Or you can pick your favorite stocks.
In fact, the covered call is most suited for those who have favorite stocks that they want to hold for a long time.
The covered call is to add that little supplemental income while the stocks are being held.
This is how covered calls should be viewed rather than as a trading vehicle.
Conclusion
We encourage the reader to perform a similar backtest study using monthly covered calls. Try also out-of-the-money versus in-the-money covered calls.
This exercise will give you a firmer grasp of the covered call concept.
In particular, you will come to realize that it is actually profitable to have the call option showing a negative P&L and to have the stock be called away because it is the stock price going up that is the main driver of profits in a covered call.
This also means that you will become a better covered-call writer if you become better at predicting when the stock price is going to go up.
Or if you can find a combination of indicators that can predict direction.
In this study, we used the moving average with the MACD.
We are not claiming that this will be the best predictor of price movement.
Certainly, many other indicators or systems can determine a trend.
And you may have your own.
The main thing is to test it out in a backtest, as we have done.
We hope your enjoyed this article on selling weekly covered calls.
If you have any questions, please leave a comment or send an email.
Trade safe!
Disclaimer: The information above is for educational purposes only and should not be treated as investment advice. The strategy presented would not be suitable for investors who are not familiar with exchange traded options. Any readers interested in this strategy should do their own research and seek advice from a licensed financial adviser.

Original source: https://optionstradingiq.com/selling-weekly-covered-calls/


