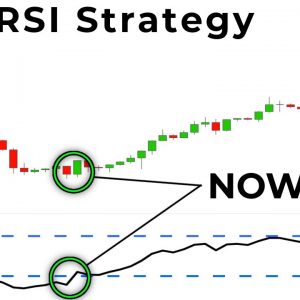
The ONLY RSI Trading Strategy That PERFECTLY Times Market Reversals…
TTC Forex University Details – https://ttcfxuniversity.com/pre-launch-sale The RSI Indicator can be an incredible tool to add to your trading arsenal. We can you the RSI to help us find outstanding…
Read More »
How Does The RSI Indicator Work? Learn How To Read The RSI Indicator When Trading.
The RSI (Relative Strength Indicator) is a momentum oscillator that measures the speed of price movements. The RSI can be used in a few different ways to develop a trading…
Read More »EUR/USD Forecast: Failure to Hold Above Parity Opens Up December 2002 Low
EUR/USD may fall towards the December 2002 low (0.9859) as the Relative Strength Index (RSI) sits in oversold territory.
Read More »USD/JPY Clears June Range to Push RSI Towards Overbought Territory
Looming developments in the Relative Strength Index (RSI) may point to a further advance in USD/JPY as the oscillator is on the cusp of pushing into overbought territory.
Read More »USD/JPY Rally Pushes RSI Back into Overbought Territory
USD/JPY may continue to appreciate over the coming days as the recent rally pushes the Relative Strength Index (RSI) back into overbought territory.
Read More »RSI Divergence
RSI Divergence Cheat Sheet Bullish RSI Divergence A bullish RSI divergence pattern is defined on a chart when price makes new lower lows but the RSI technical indicator doesn’t make…
Read More »RSI Indicator Cheat Sheet
What is the RSI indicator? The RSI indicator buy and sell signals are based on oversold and overbought conditions on a stock chart. The RSI is a measurement of price…
Read More »


