Contents
-
-
-
-
-
- Expiration Graph
- Current Payoff Curve
- The Greek
- When Might A Trader Use This Spread?
- Closing the Back Ratio Spread
- Frequently Asked Question
- Conclusion
-
-
-
-
Today, we will be talking about the back ratio option spread.
In particular, we will look at the call-back ratio spread on SPX.
This spread can be constructed with call options or put options.
It will be easier to explain if we jump straight to an example.
On January 10, 2024, SPX was trading at 4775, and an options trader sold one call option above the money.
And bought two call options further above the money.
Date: January 10, 2024
Price: SPX @ 4775
Sell one January 26 SPX 4830 call at $20.23
Buy two January 26 SPX 4875 calls at $8.79
Net credit: $265
Expiration Graph
Looking at the expiration graph (blue line below), we see that this trade has a max loss of $4235 where the line dips into a “valley of death”.
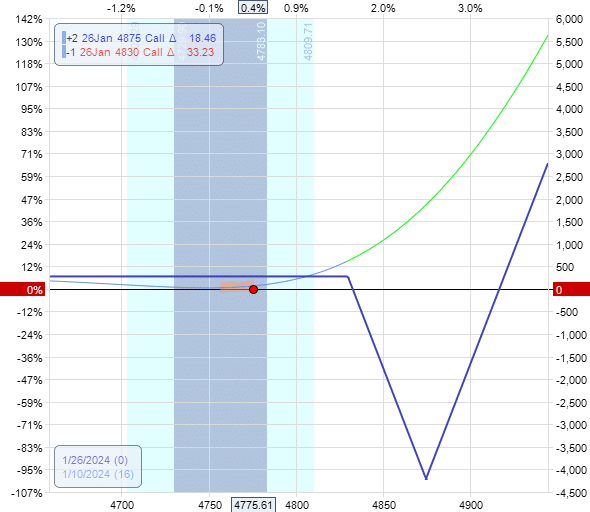
However, this can only happen at expiration (in our example, in 16 days) and only if SPX lands on 4875
If it were to happen that SPX is at 4875 at expiration, the call options would be worthless because SPX had not exceeded the call strike price of 4875. So, the trader would not have profited from the long calls.
The short call with a strike price at 4830 would be 45 points in the money. That is a loss of $4500. Since $265 credit was collected when initiating the trade, the net loss would be $4235 if SPX is at $4875 at expiration. This would be the max loss in the trade if held to expiration and would be very unlucky.
Current Payoff Curve
A rosier picture occurs when you look at the current payoff curve (or the T+0 line). This curve shows the profit and loss today, as opposed to expiration.
We see that it slopes up to the left and up to the right. That means that we profit if the SPX price goes down and also if it goes up.
We do not have to pick the direction correctly to profit. It is a non-directional strategy.
The Greeks
That is why the directional delta is very small.
Delta: 3.6
Theta: -52
Vega: 169
However, the negative theta is significant. Negative theta means that the trade loses money as time passes.
Most traders of this spread will only stay in this trade for a very short time. In our example, they might stay in for a day or two and exit. This keeps any losses to a minimum. The longer you stay in the trade, the more you can lose. In fact, if you stay in the trade till expiration (don’t do that), you can lose up to the maximum loss.
The trade is vega positive because we buy more options than we sell. So it has the characteristics of a long option – long vega and negative theta.
When Might A Trader Use This Spread?
The ratio spread in this form is used when the trader believes that a large price move will happen but does not know its direction.
For example, known future news events that can potentially move the markets, such as elections, earnings/economic reports, FOMC meetings, federal policy announcements, etc.
These are what is referred to as “known unknown” events. We know the event will happen, but we do not know what the outcome or reaction would be. These events are tradable and hedgeable.
As for “unknown unknown” events (such as black-swan events), these events are not tradable but hedgeable.
In our example, the back ratio spread was initiated one day before the CPI (Consumer Price Index) economic numbers were released.
The trader could have attempted to trade the event by initiating a strategy that would profit in the event of a large move in an unknown direction.
Another trader might have a bunch of income delta-neutral strategies, such as iron condors, which do not like large price moves. So, that trader may hedge the portfolio by adding a back ratio spread that does like large price moves. If the iron condors lose money due to a large price move, the back ratio can make up some of that money.
Closing the Back Ratio Spread
Let’s see how our example trade did.
Did SPX make a large move after the CPI report?
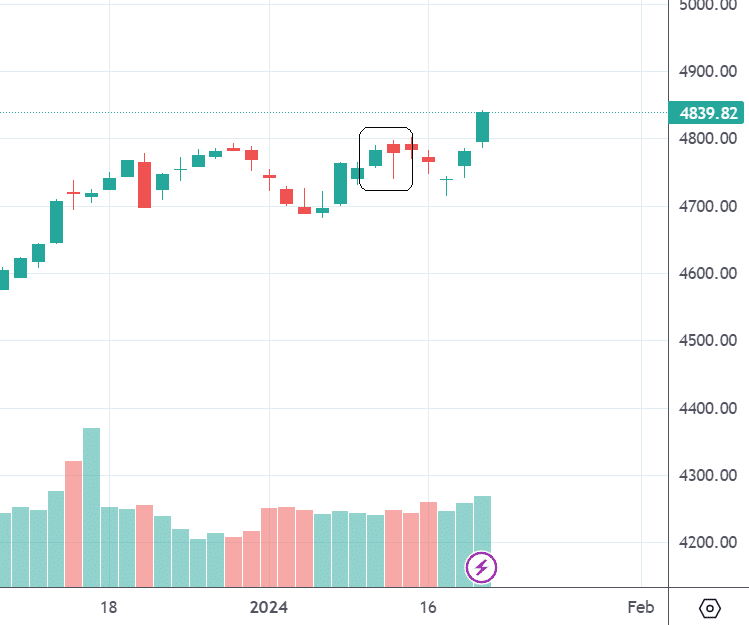
Not really. It was almost a non-event.
Did the back-ratio spread make any money? Not really; the price did not move enough.
Did the back ratio spread lose any money? Not really – if the trader closes the trade the next day.
The next day, the trader decided to close the spread by:
Date: January 11, 2024
Price: SPX @ 4768
Buy to close one January 26 SPX 4830 call at $14.64
Sell to close two January 26 SPX 4875 calls at $6.07
Debit: -$250
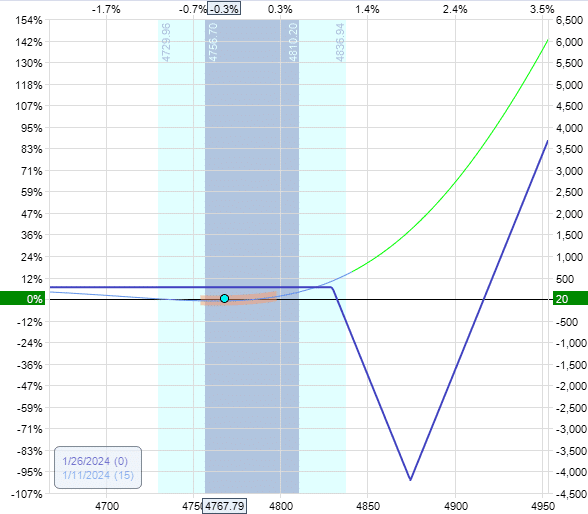
The graph looks more or less the same as when it started.
A credit of $265 to start and a debit of $250 to close means a profit of $15. With fees and commission, that would be less. Let’s call it break-even.
Frequently Asked Questions
How does the back ratio spread different from the ratio spread?
The back ratio spread is when you sell one option and buy two options further away. The ratio spread (also known as the front ratio spread) is when you buy one option and sell two options further away.
Can it be at a different ratio?
Yes. A back ratio spread can be selling two options and buying three options, creating a ratio of 2 to 3. To be a back ratio, you must buy more than you sell.
Can the back ratio option spread profit from FOMC announcements?
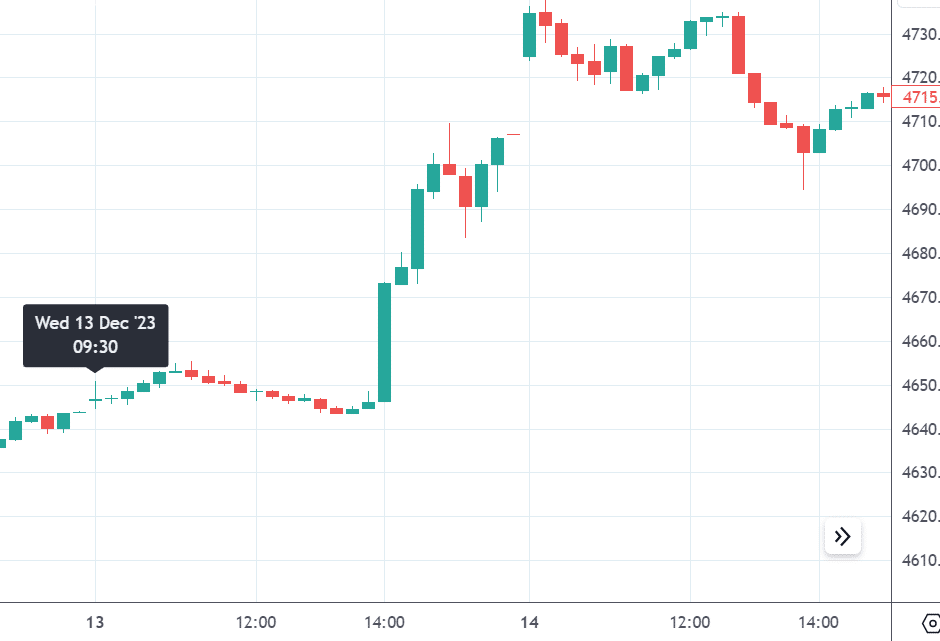
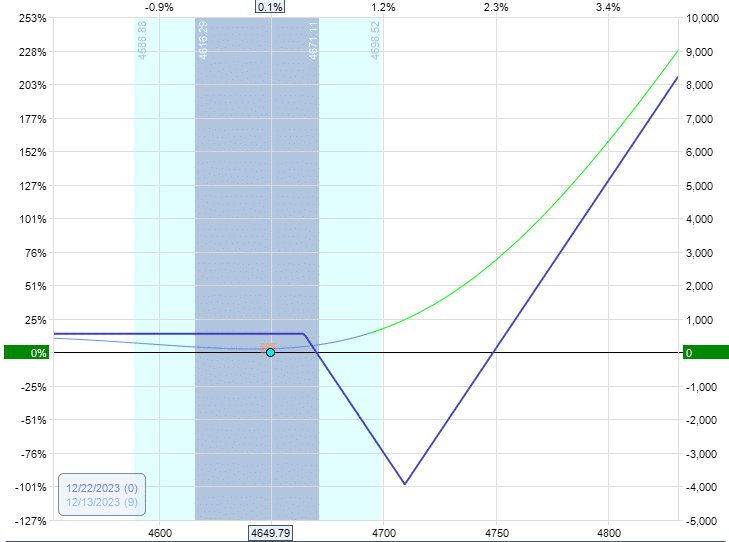
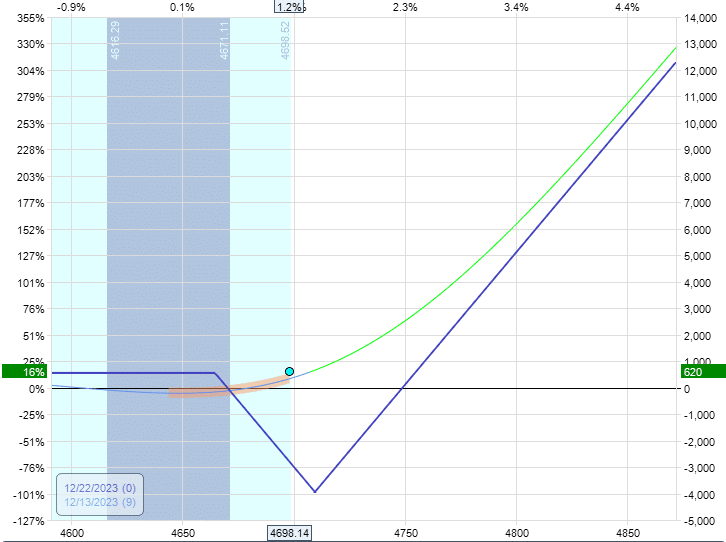
Sometimes. The last FOMC announcement on December 13, 2023, at 2 pm EST, triggered a price move big enough for the back ratio to be profitable.
Here is a 15-minute chart on that day:
Here is a simulation on OptionNet Explorer one hour after the market open on that day when the back ratio spread could have been initiated:
After the FOMC announcement, one hour before the market closes, the spread was showing good profits:
The next day after the gap-up, it looked even better:
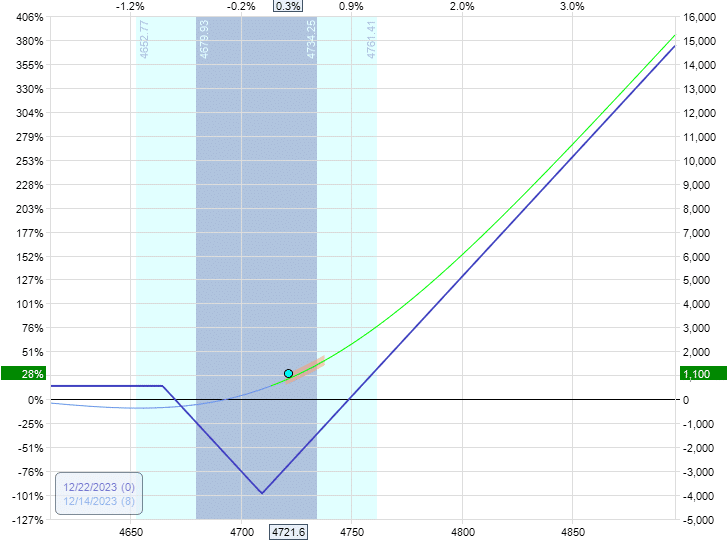
Live results can differ from the model due to market factors, fills, slippages, commissions, etc.
Can The Back Ratio Spread Profit From Earning Announcements?
Sometimes, if the price moves enough to overcome the volatility crush that occurs post-earnings.
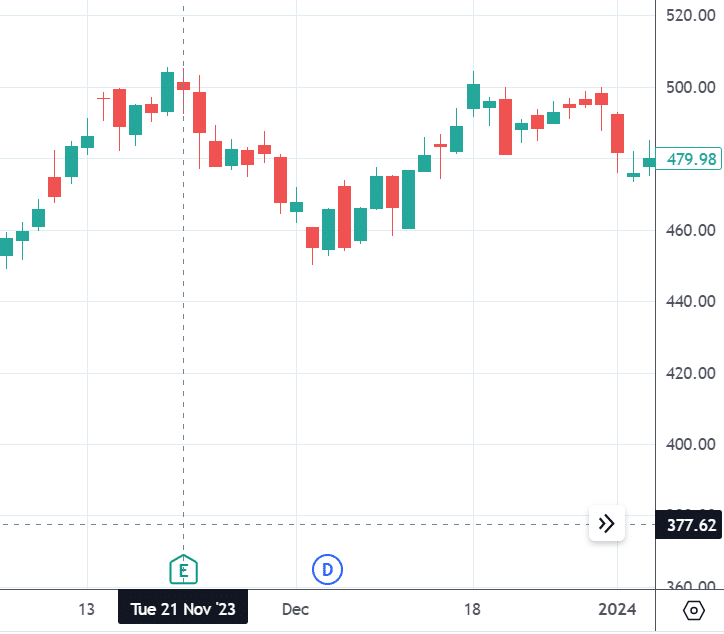
After the market closes, Nvidia (NVDA) will announce earnings on November 21, 2023.
Suppose on that day, a back ratio spread is initiated:
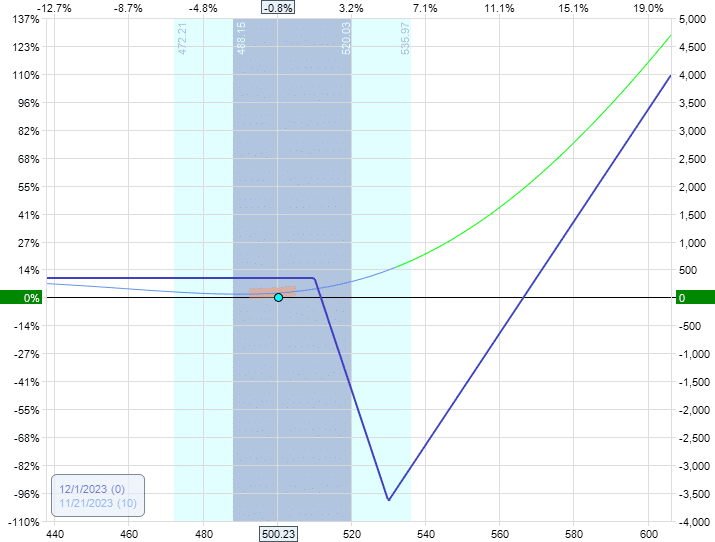
This time, we are using a 2-to-3 ratio spread by buying three 530 calls and selling two 510 calls – all expiring on December 1.
The stock did not move a whole lot:
The next day, depending on when you checked, it could have made a bit of profit:
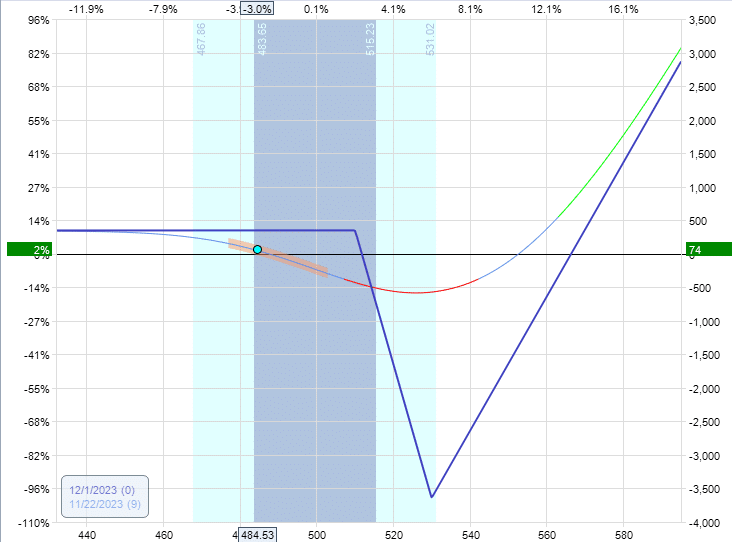
But even in one day, the T+0 line has sagged a lot due to the volatility crush.
In the case of Microsoft (MSFT) earnings, it didn’t work out:
Are There Other Alternatives To The Back Ratio Spread?
Yes. Other options strategies can profit from a large move without regard to direction. The back ratio spread is not the only one.
There is the long straddle, long strangle, and reverse iron condor with similar properties as the back ratio spread.
Conclusion
The back ratio spread is a good tool to add to your toolbox. Use it when you think there is a major event and don’t have an opinion on the direction.
While the expiration graph may look scary with the Valley of Death, it is less risky if you close the spread very quickly before time decay kicks in.
We hope you enjoyed this article on the back ratio option spread.
If you have any questions, please send an email or leave a comment below.
Trade safe!
Disclaimer: The information above is for educational purposes only and should not be treated as investment advice. The strategy presented would not be suitable for investors who are not familiar with exchange traded options. Any readers interested in this strategy should do their own research and seek advice from a licensed financial adviser.

Original source: https://optionstradingiq.com/back-ratio-option-spread/


