Sector rotation is an investment strategy that moves funds between different sectors based on economic cycles or momentum.
You’ll shift your assets to capitalize on sectors likely to outperform in various phases—like technology during growth and utilities during downturns if you’re trading based on economic cycles.
There are 11 market sectors, and all have different underlying factors that make them move.
One of the easiest ways to do this is by using sector ETFs.
Below, you will learn more about how this works and how to trade it properly.
Contents
-
-
-
-
- What Is Sector Rotation Trading?
- Understanding Economic Cycles And Sector Performance
- Momentum Components
- Risks Involved In Sector Rotation
- Trading Rotations
- Conclusion
-
-
-
What Is Sector Rotation Trading?
Let’s first get a working definition of what sector rotation is and what the different sectors are.
Definition of Sector Rotation
At its core, sector rotation trading is an active trading strategy where you move portfolio allocations between the different sectors of the market to take advantage of their cyclical performance or trading momentum.
By reallocating your investments based on the current economic cycle—whether it’s recession, growth, or peak—you can potentially capitalize on sectors expected to outperform.
For example, during economic expansions, you might focus on sectors like technology and consumer discretionary, which tend to excel.
Conversely, when downturns occur, you’d want to evaluate defensive sectors such as healthcare and utilities, known for their resilience and more stable price movement.
The economic strategy relies heavily on historical data and economic analysis, which can be difficult as you need to know which part of the economic cycle you are currently in.
This can be more or less a complete guess based on economic indicators.
Momentum is the other way to trade sector rotation, which is almost strictly technical.
You look for the sectors that are leading and buy into those, and you look at sectors that are falling, and either short them or just stay out of them.
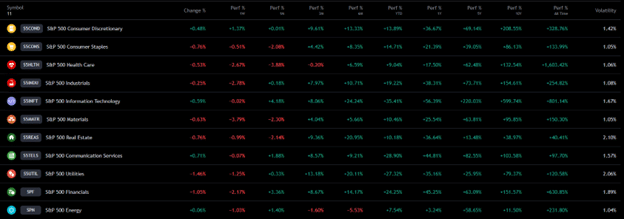
One easy way to do this is to use a sector watchlist like the one here:

This will allow you to see what sectors are outperforming at a glance.
What are the Stock Market Sectors
Let’s now take a look at what the sectors are and how you can trade them.

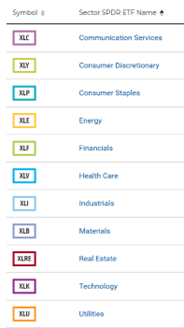
Eleven distinct market sectors have their tradable ETFs (depending on how you classify them, there can be many more segments to the indexes, but for our purposes here, we will be using the 11 standard sectors).
These sectors include Communication, Consumer Discretionary, Consumer Staples, Energy, Financial, Health Care, Industrials, Materials, Real Estate, Technology, and Utilities.
To learn more about the individual sectors, you can refer to this article here.
For now, we are just focusing on the tickers.
You can see the ticker associated with each sector to the right courtesy of the sectors per website.
Other companies have sector ETFs, but the SPDRs typically have the most liquidity, which is why they are used here.
Understanding Economic Cycles And Sector Performance
Now that you have a basic understanding of the strategy and the sectors let’s jump into some of the more advanced parts of the strategy.
First up is understanding economic cycles.
This is vital for sector performance when making trading decisions based on them.
The economy moves through four distinct phases: Expansion (early and late), Peak, Recession, and Trough, each offering unique opportunities and challenges for different sectors.
Economic Cycle Phases
Expansion Phase (Early) During the initial expansion phase, which typically lasts 12-18 months, economically sensitive sectors like technology, consumer discretionary, and industrials tend to outperform as economic activity accelerates and capital investment increases.
Expansion Phase (Late) In the later part of the expansion phase, usually lasting 2-3 years, financials and materials sectors often excel due to rising interest rates and increased commodity demand.This phase is characterized by robust consumer spending and business investment.
Peak Phase As the economy reaches its peak, typically lasting 6-12 months, inflation pressures become more pronounced.During this time, energy and materials sectors often outperform, while defensive sectors like utilities and consumer staples begin to strengthen.Strong sectors also often continue to outperform during the expansion phases.
Recession Phase During the recession, which historically averages 11-18 months, corporate profits decline, and defensive sectors such as healthcare, utilities, and consumer staples typically demonstrate the strongest relative performance due to their stable earnings and dividends.
Trough Phase At the economic bottom, lasting approximately 6-12 months, early cyclical sectors often begin to recover first, particularly consumer discretionary and technology, as they anticipate the next expansion.
As of late 2024, the time of this writing, many economists suggest we’re navigating between the late expansion and peak phases, characterized by persistent inflation concerns and central bank monetary policy decisions.
Key Indicators For Sector Rotation
Now that you know the phases, let’s look at some economic indicators that can help determine our phase.
Gross Domestic Product (GDP) is a critical indicator to watch.
Coming out once a quarter, it signals whether the economy is expanding or contracting, according to the consumer.
Unemployment rates also influence consumer spending and sector performance.
Increasing or high unemployment, compared to the average, can indicate economic trouble, leading to the latter two phases.
Inflation rates are also incredibly important to watch.
Still, these can be tricky as higher inflation can be seen in both expansion and recession depending on other things like money supply, consumer spending, and what is driving the expansion, low rates, or innovation.
Finally, there is the Yield Spread.
The 10-2 Year Treasury Yield Spread predicts economic growth, with an inverted yield curve often signaling a recession on the horizon.
Momentum Components
Now that you know how to watch the economy’s cycles, let’s look at how to use sector rotation in momentum trading.
The first would be to utilize a screener like the one above from Tradingview, but Barchart and many other financial sites have a sector heatmap.
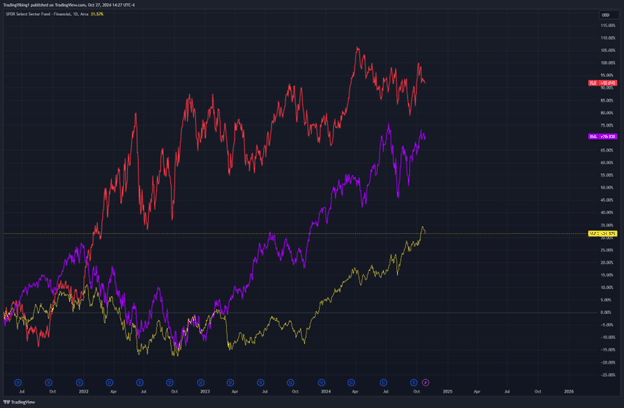
The second way to visualize this would be to use a combination chart like the one below on Tradingview, where you can watch the percentage change of the sector ETFs when compared to each other.
The below is a daily, but whatever timeframe you trade off of would work.

Next up is Volume.
Once you have narrowed down which sectors you want to trade, look at a regular ETF chart and volumes.
Are they healthy, stable, and increasing, or are they light and decreasing?
A weak volume breakout may signal weakness and might be worth skipping that ETF.
The last thing to look at would be other technicals.
Where is the price compared to the 200-day moving average, the 50-day moving average, and any trend lines?
Also, where are the RSI and MACD sitting?
All of these can be important factors when trading momentum-based sector rotation.
Risks Involved In Sector Rotation
While sector rotation strategies can beef up your investment returns, they come with a few risks you must be aware of.
The first, and probably the largest, is that you are timing the market.
Being early is not the worst thing, as you would likely need to weather some additional drawdown, but if you are completely incorrect, you need to know when you want to stop out of a trade.
Another risk is the cost of the transactions.
Typical buy-and-hold investors do not incur the same costs as active traders, which can decrease your profits.
However, with the advent of commission-free trading, this is something that depends on the broker you are using.
The final risk is sector concentration.
It is possible to be in only one or two sectors at a time, which means that most of your capital is tied up in these trades.
If the sector starts to underperform, then you could see an outsized loss in your portfolio.
The simple way around this is to only allocate a certain amount of your portfolio per sector.
This lets you always be folly invested, but allocations depend on your rotation strategy.
Historical data shows that sector rotation can outperform static portfolios, but its effectiveness varies based on economic cycles and the sectors you choose.
This should drive home the idea that a simple buy-and-hold could be a better choice unless you are prepared to research the economy and the ETF deeply.
Trading Rotations
So now that you have tools on how to trade sector rotation, how do you actually place the trade?
Well, this is something that is highly dependent on the individual and their trading strategy.
One common way to trade sector rotation is to look for the sector(s) in question to backtest some form of technical support to get long.
Many people use one of the moving averages for this because they are simple to watch.
Another less popular method is just to buy whatever sectors are leading that period.
For example, if your trading is based on daily charts, as soon as a new sector enters the leading sector position, you will exit your current trade and enter that new ETF.
The problem with this is that it can cause a lot of back and forth between sectors.
Conclusion
Sector rotation offers a powerful way to align your portfolio with changing economic conditions and market momentum, giving you the potential to outperform static investment approaches.
By understanding economic cycles and technical momentum, you can make more informed choices about when and where to shift capital, potentially maximizing returns while managing risk.
Given the positives, it’s still essential to approach sector rotation with a clear strategy and willingness to monitor shifts actively, as mistiming can lead to significant drawdowns.
For those ready to adapt, sector rotation could be a game-changer in active investment strategies.
We hope you enjoyed this article on sector rotation.
If you have any questions, send an email or leave a comment below.
Trade safe!
Disclaimer: The information above is for educational purposes only and should not be treated as investment advice. The strategy presented would not be suitable for investors who are not familiar with exchange traded options. Any readers interested in this strategy should do their own research and seek advice from a licensed financial adviser.

Original source: https://optionstradingiq.com/sector-rotation/


