


Credit spreads and debit spreads are foundational building blocks that are needed in more complex options structures, such as the iron condor with two credit spreads and the all put butterfly composed of a credit and a debit spread.
Most readers may already understand the basic difference between a credit spread and a debit spread.
However, we will get into some deeper concepts near the end.
Contents
-
- Bull Put Credit Spread
- Bull Call Debit Spread
- Difference Between Put Credit Spread And Call Debit Spread
- Volatility Risk Premium
- Probability Of Profit
- Bear Call Credit Spread
- Bear Put Debit Spread
- Credit Spreads And Debit Spreads Are Two Sides Of The Same Coin
- Summary
Bull Put Credit Spread
Credit spreads can be made out of put options or call options.
Let’s start with a put credit spread on the ticker symbol SPY (S&P 500 ETF).
In a single order, we sell one put option (short) and buy one put option (long).
Date: April 10, 2026
Price: SPY at $679.53
Sell to open one contract May 15 SPY $645 put @ $4.79
Buy to open one contract May 15 SPY $640 put @ $4.17
Both options must have the same expiration date, in this case, expiring on May 15, about 35 days out.
The strike price of the short put option is $645.
The strike price of the long put option is $640.
For a put spread to receive a credit at trade initiation, the strike price of the short put option must be higher than the strike price of the long put option.
For put options of the same expiration, the higher strike option will always be priced higher than the lower strike option.
The short put option with a strike price of $645 is priced at $4.79 per share.
Since we are selling one contract (which represents 100 shares), we are receiving $479 for shorting this put option.
The long put option with a strike price of $640 costs $4.17 per share, or $417 per contract.
We are buying one contract and had to pay $417.
The definition of a credit spread is that we collect a credit at trade initiation, also known as a premium.
In this example, we collected a premium of $62 because…
$479 – $417 = $62
This payoff graph of the put credit spread shows P&L (profit and loss) on the left vertical axis and the price of the underlying (SPY) on the bottom horizontal axis.
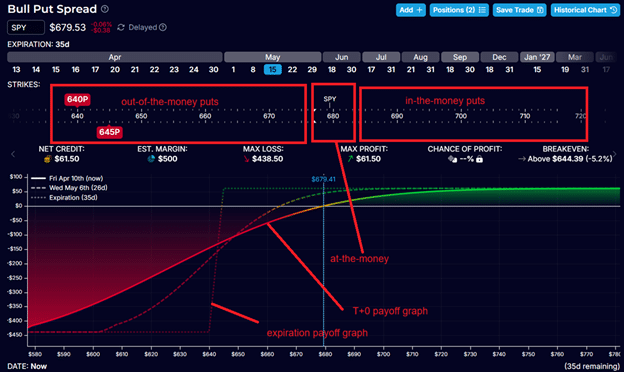
The payoff graph at the time of trade initiation is shown as the “T+0 payoff graph,” i.e., the current time plus zero days.
The payoff graph will change as time passes and as time gets closer to expiration.
At expiration, the payoff graph will be shown as the “expiration payoff graph”.
Right now, at trade initiation, the underlying stock price is $679.53 (around $680), and the P&L shows zero profit.
As the price of the underlying goes up, the P&L will increase.
Hence, this is a bullish credit spread because we want SPY to go up.
As the underlying stock price increases, the credit spread will make money.
Credit spreads are directional, to a certain extent.
Credit spreads constructed with put options are always bullish, regardless of whether they are out of the money (OTM), at the money (ATM), or in the money (ITM).
Put options are at-the-money if their strike price is close to the current price of the underlying stock.
Put options are out of the money if their strike prices are below the stock’s current price.
Put options are in-the-money if their strikes are above the stock price.
Credit spreads are typically constructed using out-of-the-money strikes, as in our example, where the $645 and $640 strikes are below the current stock price of $680.
Bull Call Debit Spread
If we want to construct a bullish spread with call options, it will have to be a debit spread.
We need to buy a call option and then sell a call option at a higher strike price.
For example, buying the $275 strike call option and selling the $280 call on Apple (AAPL) when AAPL is trading at $260.
Date: April 10, 2026
Price: AAPL @ $260
Buy to open one contract May 29 AAPL $275 call @ $4.15
Sell to open one contract May 29 AAPL $280 call @ $2.99
Net Debit: $116
It costs $415 to buy one contract of the $275 call option.
But since we collected $299 for selling one contract of the $280 call, our net debit to initiate the trade is $116.
$415 – $299 = $116
A call debit spread requires an upfront cost, similar to purchasing a long call, but the total cost is lower.
You can think of the spread as buying a call option while simultaneously selling a higher strike call to partially offset the expense.
The higher strike call is less valuable because it is further out of the money.
Hence, it can only partially offset the cost, and we still have to pay a net debit for the spread.
For call options, a strike price above the current underlying price is considered out-of-the-money, while a strike below the current price is in-the-money.
This is the opposite of how moneyness is defined for put options.
Illustrated below is our call debit spread with strikes $275 and $280 being out of the money.
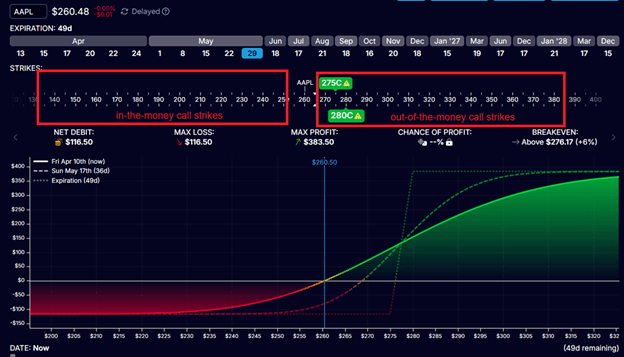
Traders like to construct spreads using out-of-the-money strikes because those strikes are more liquid and have tighter bid-ask spreads than in-the-money options.
Hence, it is typical to see a call debit spread with strikes that are either at-the-money or out-of-the-money, as in our example.
Looking at the payoff graph, we see that our call debit spread makes money as the price of the underlying goes up.
Call debit spreads are always bullish.
It is impossible to construct a bearish debit spread using call options.
Difference Between Put Credit Spread And Call Debit Spread
What is the difference between a put credit spread and call debit spread if both of them are bullish?
If both are constructed using out-of-the-money options (as is typically done and as in our examples), the call debit spread will have a better reward-to-risk ratio.
Looking at the expiration payoff graph of the call debit spread…
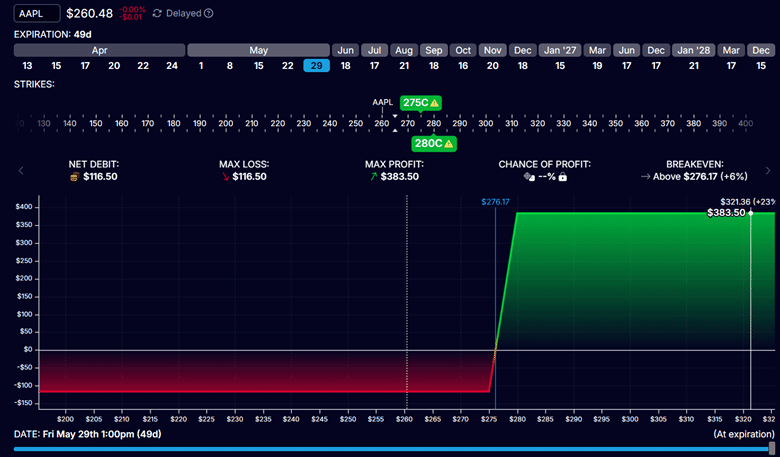
We see that our max potential profit is $384.
Our maximum potential loss is $116 (the initial debit paid).
This gives a reward-to-risk ratio of 3.3 (calculated by $384 divided by $116).
Based on the “max profit” and “max loss” numbers from the SPY put credit spread example, the reward-to-risk ratio is less than 1.
Reward-to-risk ratio: $61.50 / $438.50 = 0.14
This is the same as saying it has a risk-to-reward ratio of 7.1…
Risk-to-reward ratio: $438.50 / $61.50 = 7.1
We are risking $7 to make $1 in the credit spread.
We are risking $1 to make $3 in the debit spread.
Either way you look at it, reward to risk or risk to reward, it is more favorable in the debit spread than in the credit spread.
This also means that a debit spread delivers a higher return when it wins.
Yield, as defined as the profit relative to the capital at risk, is typically greater because the amount at risk is smaller.
So any profit represents a larger percentage gain.
As such, this characteristic makes it attractive for smaller accounts.
If that is the case, why do we prefer credit spreads over debit spreads?
Volatility Risk Premium
It is because the credit spread has an additional edge known as the volatility risk premium.
VRP is the phenomenon where implied volatility (IV) is typically higher than realized volatility.
Markets tend to overestimate future volatility compared to what actually happens.
This causes options to be slightly overpriced.
Selling overpriced options is one edge in the market that a credit spread can capitalize on.
In a credit spread, we are a net seller of options because we are receiving a credit from the transaction.
In general, the more an option is overpriced, that is, the higher its implied volatility relative to fair value, the more theta it has.
Theta is one of the option Greeks.
Credit spreads have positive theta.
This means that they can profit even if the underlying does not move.
Time is working in our favor.
In the credit spread example above, if SPY stays at $680 at expiration, the credit spread will achieve a maximum profit of $62.
The credit spread can generate income independent of the underlying price movement.
This income is generated by its positive theta.
In debit spreads, we are a net buyer of options because we pay a debit to initiate the spread.
Debit spreads have negative theta.
Hence, their value decays if the underlying doesn’t move fast enough and far enough.
Time is working against us.
Looking at our debit spread example, if AAPL stays at $260 at expiration, the debit spread will incur a max loss of $116.
Bullish OTM credit spreads benefit from volatility risk premium and therefore have a natural statistical advantage over bullish OTM debit spreads.
One practical takeaway is that trade selection should depend not only on direction but also on expected volatility, time decay, and position sizing.
A spread can be structurally correct and still be a poor trade if it is too large for the account.
Probability Of Profit
Intuitively, we can theorize that credit spreads have a higher probability of profit.
Bullish credit spreads win if the underlying goes up or stays where it is.
Bullish debit spreads can only win if the underlying goes up.
It is not a theory; it is a statistical fact that credit spreads have a higher win rate.
We will see evidence of this in the next two examples.
For a video overview, see Mastering Credit Spreads.
Bear Call Credit Spread
Consider the following bear call credit spread on Microsoft (MSFT):
Date: April 10, 2026
Price: MSFT @ $375
Sell to open one contract May 8th MSFT $400 call @ $5.50
Buy to open one contract May 8th MSFT $405 call @ $4.42
Net Credit: $108 (which is also the max profit)
Max Risk: $500 – $108 = $392
Below is the May 8th expiration option chain, with the left panel showing call options and the right panel showing put options.
The strikes are indicated in the center column between the two panels.
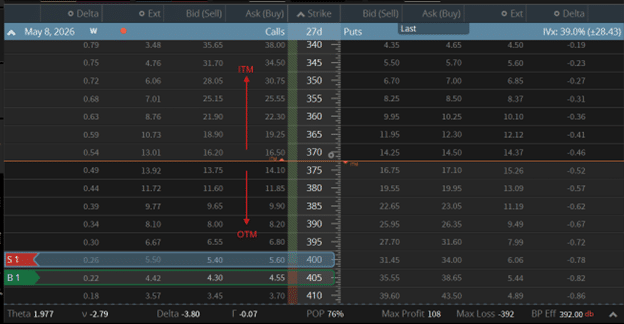
We can see that the $400-strike call option being sold and the $405 call option being bought are both out of the money since MSFT is trading at $375 per share.
The platform’s bottom-row calculations show a 76% probability of profit (POP) if the trade were held to expiration.
It also shows a positive theta of 1.977, as is expected of OTM credit spreads.
The negative delta of -3.80 indicates a bearish trade.
Taking the max loss ($392) divided by the max profit ($108), we get the Risk-to-Reward Ratio of 3.6, which can be seen from the expiration payoff graph.
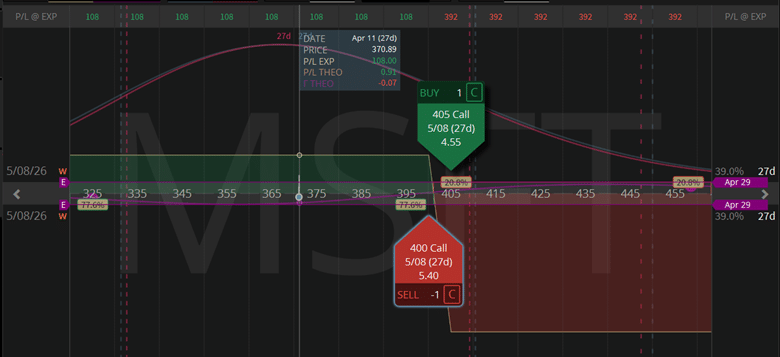
As before, the vertical axis of a payoff graph indicates the P&L.
Because the red loss value is vertically 3.6 times the height of the green gain value, it means that the maximum loss is 3.6 times bigger than the maximum profit.
Or looking at the reward-to-risk ratio: $108 / $392 = 0.27
The height of the green rectangle is only 27% that of the height of the red rectangle.
Bear Put Debit Spread
Now we buy a bear put debit spread on MSFT with the same expiration and about the same distance out of the money as in our last example.
Date: April 10, 2026
Price: MSFT @ $375
Sell to open one contract, May 8th MSFT $345 put option at $5.60
Buy to open one contract, May 8th, MSFT $350 put option at $6.85
Net Debit: -$125 (also is the max loss)
Max Profit: $500 – $125 = $375
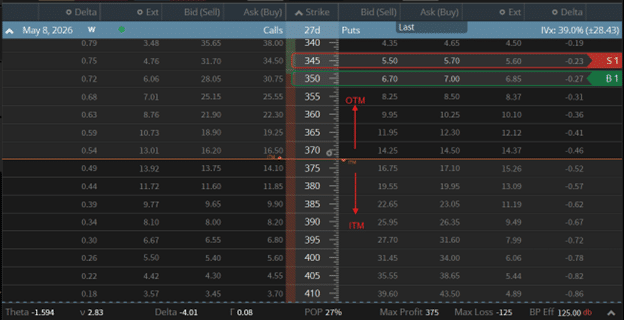
The negative Delta of -4.01 shows that the debit spread is bearish.
The negative Theta of -1.594 indicates that the debit spread loses value over time (if the price of the underlying asset does not move).
The probability of profit at expiration is only 27%, much lower than that of the credit spread.
However, look at the height of the green area of the expiration payoff graph…
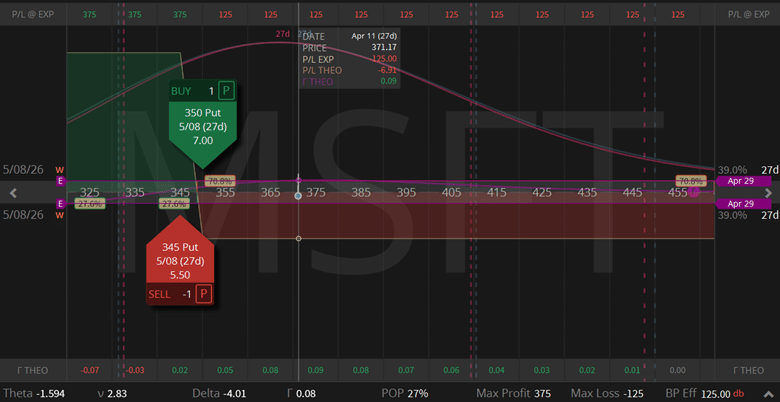
It is three times as large as the red area’s height.
Reward-to-risk ratio: $375 / $125 = 3.0
Risk-to-reward ratio: $125 / $375 = 0.3
Debit spreads have a lower win rate, but they make up for it by having larger winning trades in comparison to their losses.
A trader can be profitable trading either debit spreads, credit spreads, or a combination of both.
Credit Spreads And Debit Spreads Are Two Sides Of The Same Coin
Credit spreads and debit spreads are “vertical spreads”.
Both options in the spread share the same expiration date.
The only variation comes from selecting different strike prices vertically along the option chain.
The principle of put-call parity says that if a debit spread is constructed using a specific set of strikes, an equivalent credit spread using those same strikes will produce an identical payoff profile.
In our last example, we showed a bear put debit spread.
A bear call credit spread of the same strikes can construct the same vertical spread:
Date: April 10, 2026
Price: MSFT @ $375
Sell to open one contract May 8th MSFT $345 call option at $33.10
Buy to open one contract May 8th MSFT $350 call option at $29.40
Net Credit: $370
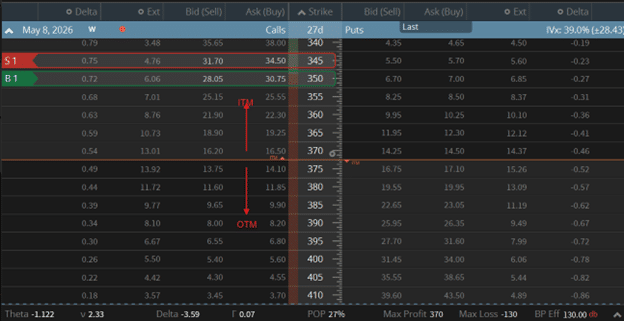
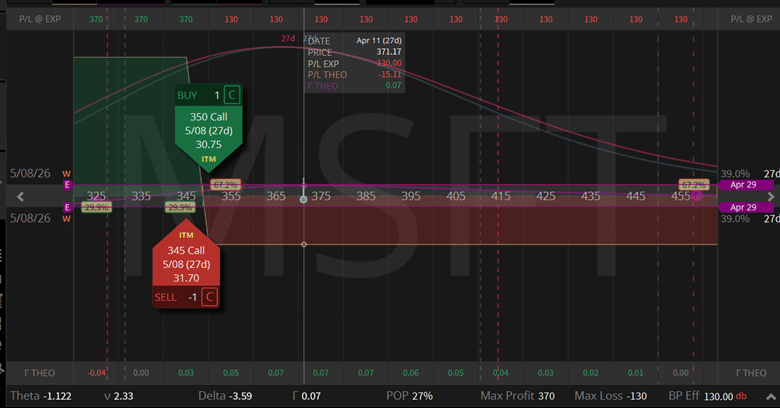
You will see that the Greeks, the POP, the risk-to-reward ratio, and the max profit or loss are similar to those in the last example.
The slight differences stem from option fill prices, which reflect the bid-ask spread. In live trading, slippage also matters.
This is one reason many traders prefer the out-of-the-money version in practice.
Better fills, tighter markets, and easier execution can matter just as much as the payoff diagram when real capital is on the line.
You will note that this bear call credit spread requires in-the-money strikes.
You can compare the bid-ask spreads in the screenshots above to see that ITM options have wider spreads and are less liquid.
While the same vertical spread can be constructed using an OTM bear put debit spread or an ITM bear call credit spread, the former is preferred due to its better liquidity.
Whether you get a credit upfront or pay a debit upfront is not relevant to the spread profitability.
They both have the same probability of profit.
Summary
The four categories of vertical spreads are:
- Bull put credit spread
- Bull call debit spread
- Bear call credit spread
- Bear put debit spread
There are no other types of vertical spreads.
There is no such thing as a bull call credit spread because all bullish credit spreads are constructed with put options.
So when someone refers to a “bullish credit spread,” it is understood to mean a put credit spread.
Likewise, when someone says “put credit spread,” we automatically know the position is bullish.
And when someone refers to a “bullish put vertical spread,” we know it is a credit spread.
The same vertical logic later shows up in structures such as the iron condor.
Similarly, a call debit spread is always bullish.
A bear call spread is always a credit.
A bearish vertical spread can be built in one of two ways:
- with put options for a debit (a bear put spread), or
- with call options for a credit (a bear call spread).
This classification holds regardless of whether the spread is constructed OTM, ATM, or ITM.
This classification holds regardless of whether the spread is constructed OTM, ATM, or ITM.
Due to better liquidity and tighter bid/ask spread, traders will prefer to construct the spread using OTM options.
Due to better liquidity and tighter bid-ask spreads, traders will prefer to construct the spread using OTM options.
Now speaking in terms of OTM spreads:
- OTM credit spreads have a higher probability of profit. OTM debit spreads better reward-to-risk.
- OTM credit spreads have a higher probability of profit. OTM debit spreads have better reward-to-risk.
- Credit spreads have theta working for you. Debit spreads have theta working against you.
Credit spreads are well-suited to high-probability, theta income, and VRP.
Debit spreads are suited to high returns on capital.
This trade-off is fundamental in options: you can prioritize probability or reward-to-risk, but rarely both simultaneously.
Traders aiming for higher rewards relative to risk often choose debit spreads.
Traders seeking higher probability tend to favor out-of-the-money credit spreads.
Credit spread has an additional slight edge due to the volatility risk premium in the options market.
Traders seeking higher probability tend to favor out-of-the-money credit spreads.
Credit spreads have an additional, albeit slight, edge due to the volatility risk premium in the options market.
Traders who can use both will have an advantage.
When they can accurately predict a strong directional move, they can utilize debit spreads for capital efficiency and high rewards.
While they can collect theta income using credit spreads, the rest of the time.
Traders who can use both will have an advantage.
When they can predict a strong directional move with accuracy, they can utilize debit spreads for capital efficiency and higher rewards.
They can collect theta income using credit spreads the rest of the time.
We hope you enjoyed this article on credit spread vs debit spread.
If you have any questions, send an email or leave a comment below.
Trade safe!
Disclaimer: The information above is for educational purposes only and should not be treated as investment advice. The strategy presented would not be suitable for investors who are not familiar with exchange traded options. Any readers interested in this strategy should do their own research and seek advice from a licensed financial adviser.
Original source: https://optionstradingiq.com/credit-spread-vs-debit-spread/