
TradeViz is a trade management and analytics dashboard that lets traders and investors view stats for their trades and portfolios.
Their intuitive dashboard and menu let you break the data down into almost any form you’d like and offer advanced analytics and planning tools if you upgrade to their paid plans.
Let’s jump into some of their features and pricing and see if TradeViz can help you.
Contents
-
-
-
-
- Dashboard and User Experience
- Advanced Analytics and Features
- Tools, Analysis, and Performance
- Broker Integration
- Educational Resources and Support
- Pricing Plans
- Final Verdict
-
-
-
Dashboard and User Experience
Tradeviz offers a very clean and modern-looking user interface that lets users set up their home page or dashboard in almost infinite ways.
The default setup is to have the trades and trade data front and center, like in the image here, but you can customize this however you would like.

One particularly useful feature for active traders is the PnL by-day calendar.
This lets you visualize how profitable you are by day, which can provide some interesting insights about potential overtrading.
From the overview dashboard, you can also navigate to all of their other offerings from the menu on the left-hand side.
The standard view for this is what you see in the image above: dropdowns that can help you navigate to all of the different tools, but they also have “Simple Mode,” which, when activated, cuts the list down to some of the more common tools like Trade Tables, calendar, and Trade Plans.
Now that you can see how the dashboard looks and feels let’s jump into some of the individual features of the TradeViz.
Advanced Analytics and Features
In addition to all the basic tables and views, Tradeviz offers dozens of other analytical tools to help you trade.
Tables
First up are the other views that you can see for your trades.
The standard view is just a chronological list of trades, but you can also adjust this to be grouped by symbol, a Tag if you have assigned one to it, by execution, and by day.
One of the more interesting table views comes from the Pivot table charting, which allows you to slice up the data and display custom views similar to what you can do in Excel.
You can also break trades down by the Trade/Day plan you set up.
This lets you look back and see if you stuck to your plan and how your executions were against what you expected.
Calendars
The calendars tab lets you break out your trading based on the Day, Week, Month, or Year; depending on the timeframe’s granularity, you can see different statistics about that time.
This can be quite useful to see if there are any trends in your trading around seasonal changes in the market.
Notes and Plans
Tradeviz software lets you add notes to your specific trades, so if you wanted to mark off an entry or exit or some piece of information that stood out to you, you could do that here.
You can also set up trade and day plans through the software.
These plans can be as simple or complex as you would like and can help you stay on track to your trading goals.
The planning functionality here is impressive; if you sign up for this software, it is recommended as a tool.
Tools, Analysis, and Performance
Tools
We can now look at some of the more advanced features of TradeViz.
First up is the actual “Tools” menu.
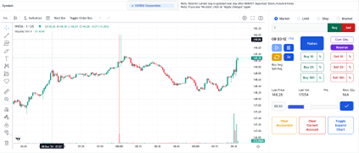
Here, they have trading simulators, which, as the name implies, lets you trade based on past data for almost any symbol.
The default symbol is the S&P500 future, but I tested it with several equities, and they all worked well to paper trade/test trade on new strategies.
Two other interesting tools available for subscribers are the options flow scan, which looks at unusual options activity (sweeps), and the dividend tracker.
Both of these can be incredibly useful in your trading or investing, especially the dividend tracker, which can help you plan out cash flow.
Tradeviz also has an options execution simulator, stock screeners, a market overview tab, and an options payoff chart, which is a risk profile for an option.
These tools are all equally useful but are things you can find elsewhere for free.
Analysis
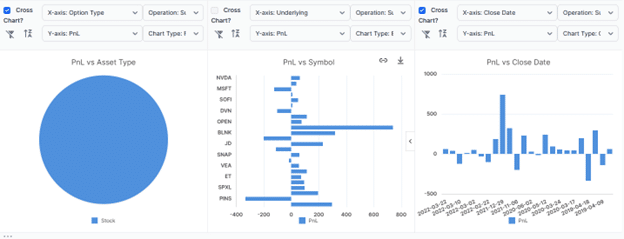
As their name implies, one of the things that makes Tradeviz stand out is their ability to visualize trade data.
This is especially true when it comes to analysis of your trades.
You can slice up your win/loss data into dozens of buckets and see nice visualizations of them all.
Win rates are broken down against price ranges, volume ranges, time of day, trade length, asset type, and more.
Looking at the analysis tab will give you unrestricted access to all the information hidden inside your trading patterns and some ideas on how to alter them to increase profitability.
Tradevz offers a few other types of analysis that are also worth a look at.
First up is exit analysis, which lets you compare what the optimal exit for a trade would have looked like vs. what you did.
Depending on your exit plan, this can be a bit hard to see, but it provides a lot of potential insight into if you’re holding on to trades for too long.
They also have technical analysis, but not your standard type of chart analysis; this shows the market against several different indicators to see how your trades compare.
It’s an interesting take on “Technical Analysis“.
Lastly is Options Analysis, which lets you run all of the same trade data over your options trades.
You can break out trade volume, win rate, and your trades vs the Greeks to see where you are excelling and where you are lacking.
Performance
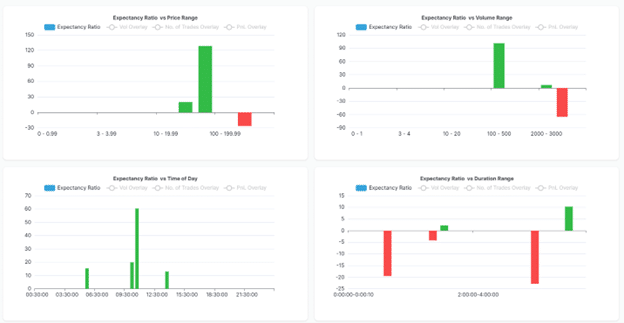
The last section we will be looking at is the Performance Metrics section.
This is an extension of much of the data we looked at in the previous sections, but it lets you see it in more common trading terms.
It will let you see your trade expectancy.
What is your account expected to do when you execute a trade based on the last x number of trades?
Additionally, you can see the R-value, Hit rate, Profit Factor, and trend analysis for your trades.
This section has a lot of potential to help you improve your trading because it can show you just how profitable you are.
Broker Integration
Now that you have seen how Traeviz can show you your data, let’s look at how we can get your trade data into the platform.
The first step is to manually import your trade data.
This works on a long list of brokers across almost every asset type that retail traders can trade.
When you go to import your data from your broker, you set a new “connection,” and Tradeviz will walk you through how to export and import your trade data from your broker and get it into the web app.
For a smaller subset of brokers, Tradeviz also supports auto-sync, which lets you automatically link your brokerage account to the application and fill out some basic details like your trading style and sync times, and Tradeviz will handle the rest.
This list of brokers is much smaller than the manual list, but it includes almost every broker that can operate in the US, so odds are you will not have an issue being able to Auto-sync your account.
Educational Resources and Support
Tradeviz offers dozens of guides on their blog about how to navigate and use their software.
They cover everything from basic How-Tos to the more advanced uses for custom dashboards and visualizations.
Since this is almost exclusively about metric visualization, they do not have much support for learning how to trade, so you should have come to the platform with this already.
If you need assistance creating a trade plan, you can always check out this link here.
Tradeviz also offers excellent customer support through either the form on their website or the support email address.
They had a fairly quick response time, although its possible response times vary depending on how many requests they receive.
Pricing Plans
Now it’s time to look at the price of Tradeviz.
You have seen all of these interesting features, but is it worth what they charge?
Tradeviz does offer a free plan that includes 3,000 executions a month and very minimal data visualization.
This plan does support the auto-sync, but everything else is fairly barebones.
They have two paid plans available, the Pro and the Platinum plan, for $20 and $30 per month, respectively.
Both allow access to unlimited executions tracked per month and the ability to track almost every asset class.
The main difference between the two plans is add-on features.
The platinum plan allows you access to things like seasonality charts, the options flow information, trade replay, backtesting, and other higher-level analysis tools.
For the extra $10/month, though, it seems like it’s well worth the extra money for the extras you receive.
Final Verdict
TradeViz offers a rich suite of tools that cater to both the meticulous analyst and the active trader looking for deeper insights into their performance.
The platform’s emphasis on customizable dashboards and detailed analytics makes it a solid choice for those who want more than just trade data tracking.
With powerful features like daily PnL visualization, advanced table filtering, robust trade analysis, and intuitive trade planning, TradeViz provides a clear picture of your trading habits.
TradeViz’s paid plans deliver an extensive, value-added package.
Whether you’re using the free tier to get started or diving into the Platinum plan for the full toolkit, TradeViz positions itself as a practical, insightful resource that can help traders make data-driven decisions with confidence; because of this, it’s at least worth your time to set up the free plan and start to look at your trading data visualized.
If you can afford it and are profitably trading, the paid plans provide a lot of added value for the cost, making them an easy sell for the data-driven trader.
We hope you enjoyed this article on TradeViz
If you have any questions, please send an email or leave a comment below.
Trade safe!
Disclaimer: The information above is for educational purposes only and should not be treated as investment advice. The strategy presented would not be suitable for investors who are not familiar with exchange traded options. Any readers interested in this strategy should do their own research and seek advice from a licensed financial adviser.

Original source: https://optionstradingiq.com/tradeviz-review/