


Contents
- Volume Profile Informs Support/Resistance Early
- Support Turned Resistance
- High Volume Nodes
- FAQ
- Conclusion
Support and resistance is one of the first concepts every trader learns, and most traders learn it the same way: drawing lines on a chart where price has previously reversed.
That approach works.
But it has a timing problem.
By the time you can draw a support line with confidence, price has already tested that level once or twice.
You’re late.
Volume Profile solves this.
By showing where the highest concentration of transactions occurred during a prior move, it can identify a likely support or resistance zone before price returns to test it, potentially giving you an earlier, higher-probability entry than traditional charting alone.
This article walks through three real trades on Verizon (VZ) from March to June 2026 that illustrate exactly how this works in practice.
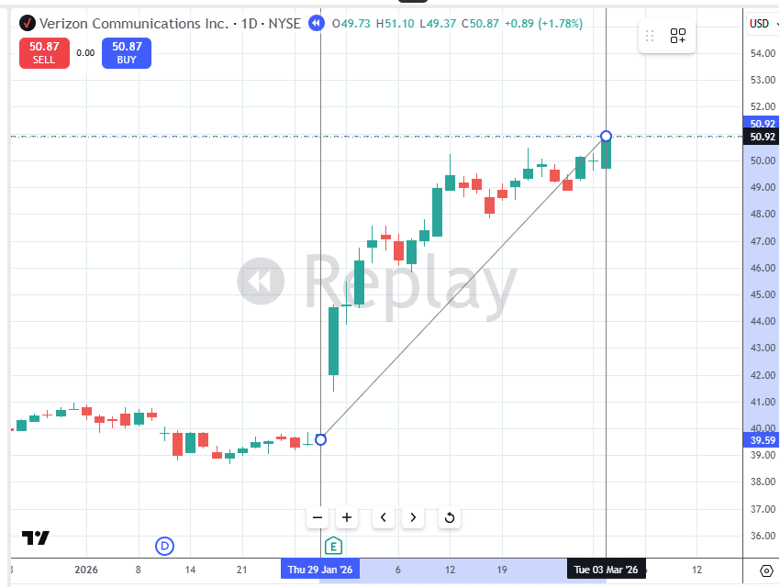
Using the Fixed Range Volume Profile tool in TradingView, we start by dragging from the start of the move to the top.
This gives a volume profile that showed the point of control (POC) at the $49 price level:
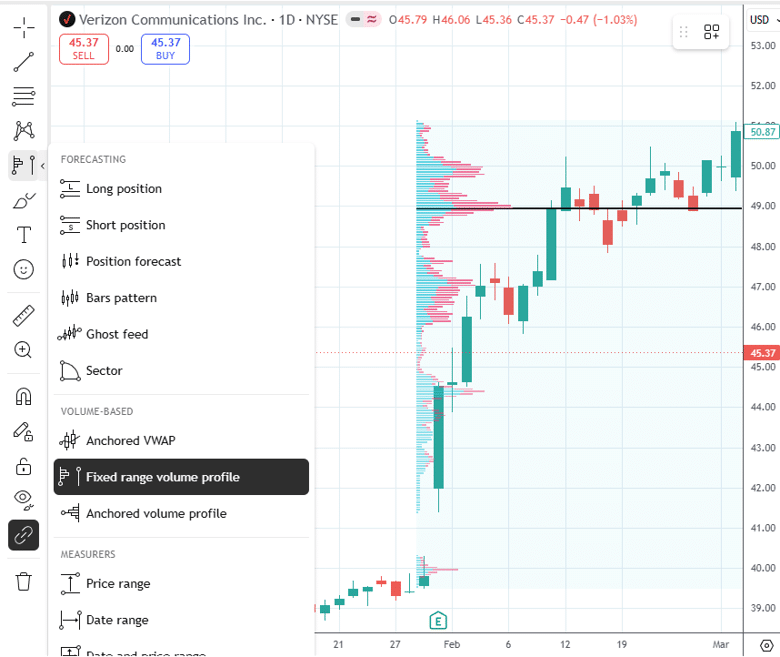
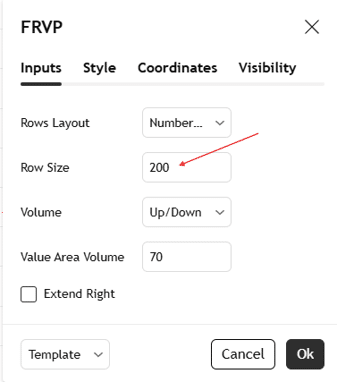
To get the higher resolution shown in the graph above, change the row size setting to a larger number like 200:
For that section of the chart, the volume profile shows the amount of volume traded at the various price levels.
Prices where there are a lot of transactions tend to be levels of support and resistance.
The point of control (POC) is the price level at which the most volume was traded, which suggests that both buyers and sellers find $49 per share to be reasonable.
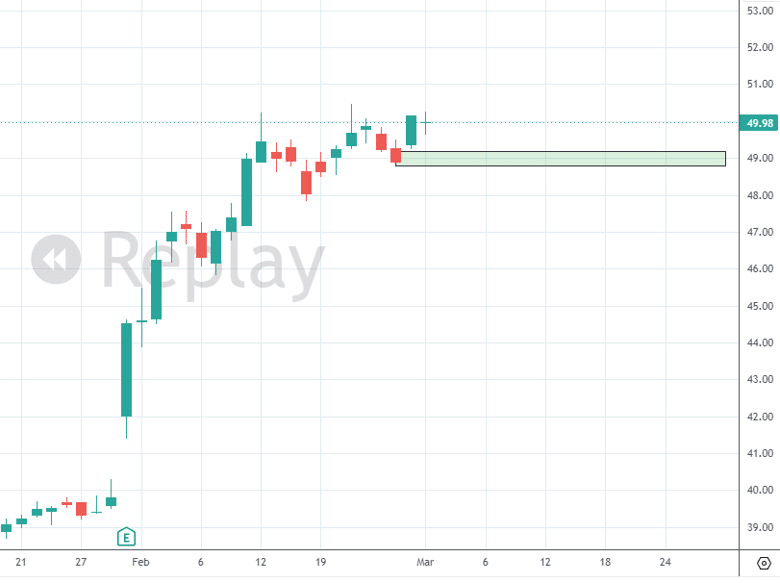
Support and resistance are not lines on a chart, but are zones of price ranges.
The trader draws a buy zone around the $49 level and sets an alert to inform him when VZ trades back down to $49.20.
On Thursday, March 19th the alert triggered as VZ dropped below $49.20 intraday.
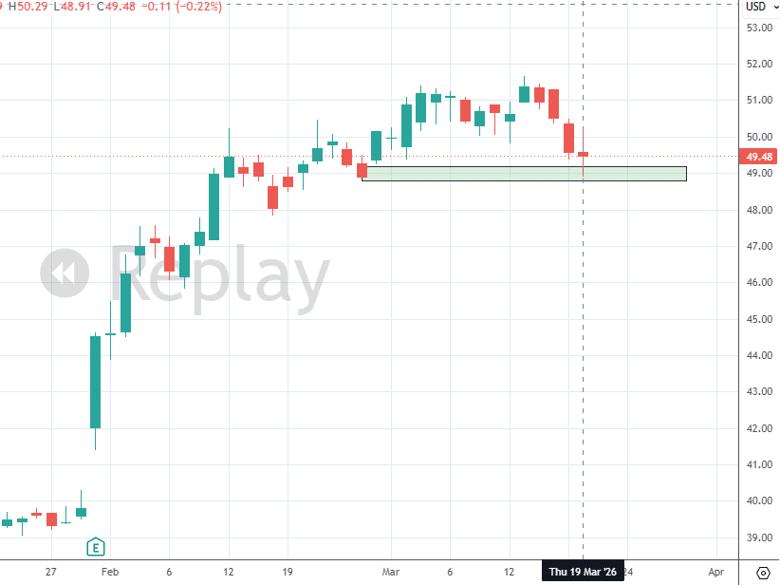
This may be a buy opportunity.
So the trader sets the alarm to wake up early on Friday as the market opens to see if there is confirmation of a potential rally.
Friday morning, March 20th, dropping to a lower timeframe to better watch the price action, he sees that VZ broke the downtrend in the one-hour chart…
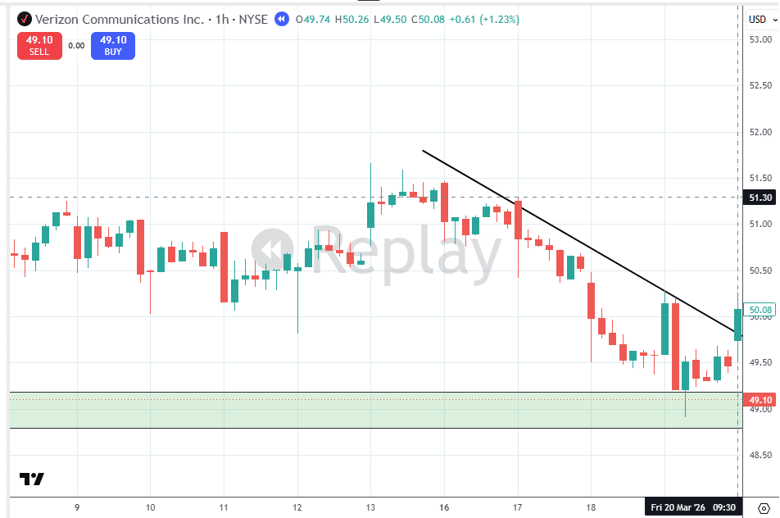
This plus yesterday’s bottoming tail candle that dipped right into the buy zone and came back up is enough to convince him to enter the trade.
He initiates a bull put credit spread.
Date: March 20, 2026
Price: VZ @ $50.08
Buy ten contracts May 1st VZ $45 put @ $0.49
Sell ten contracts May 1st VZ $48 put @ $1.23
Net Credit: $740
Max risk: $2,255
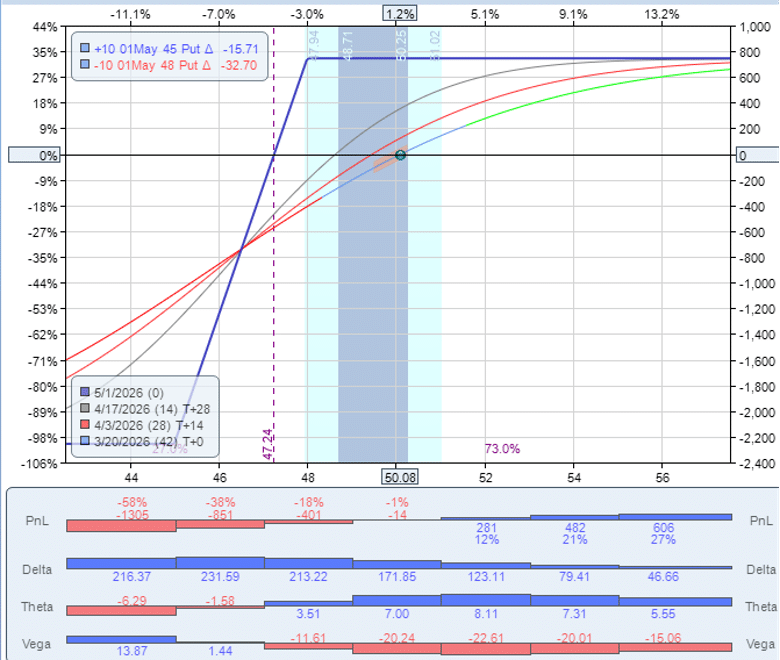
Notice how the volume profile informed not just the directional bias but the specific strike placement.
The $48 short put strike was chosen because the POC at $49 represented a high-probability support zone, placing the short strike below a well-established high-volume level gives the trade a technical rationale beyond pure probability.
Even if VZ dips back to $49, the trade remains profitable.
That alignment between technical structure and options strike placement is the core of the approach.
Four days later on Tuesday March 24th:
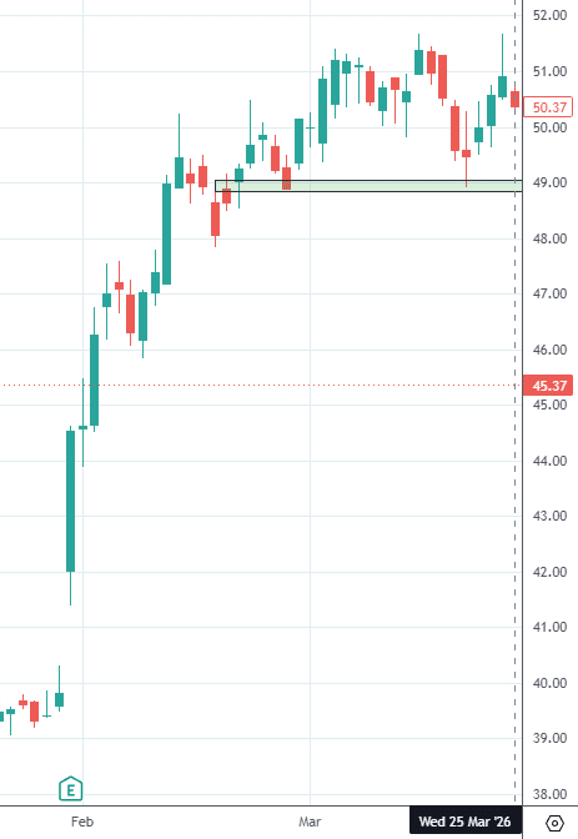 a candle with a top wick appeared, suggesting price rejection at the wick.
The trader decided to exit the position the following day on Wednesday March 25th when VZ opened lower than yesterday’s close.
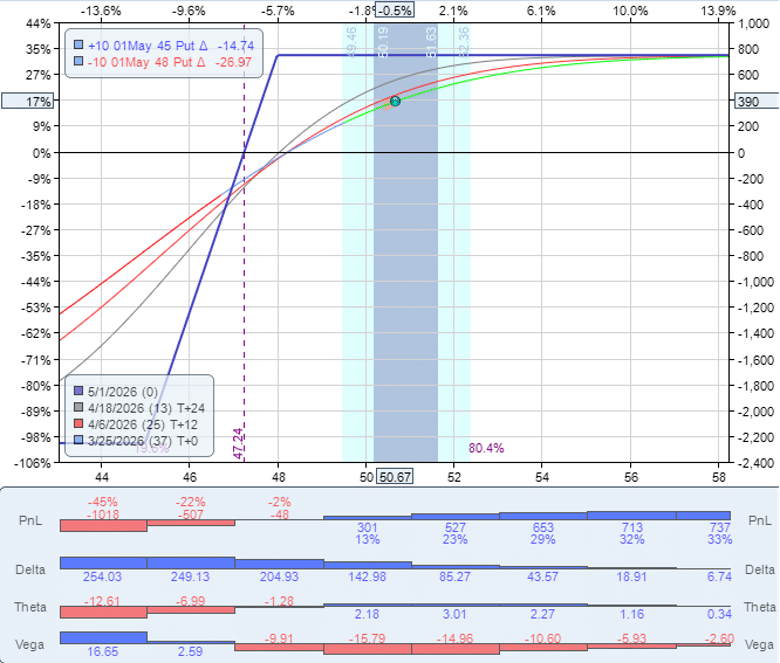
Even though the price of VZ only went from $50.08 to $50.37, the trader was able to capture a profit of $390, or 17% return on the max risk of the trade (because $390 / $2,255 = 17%).
In contrast, a stock investor who purchased 100 shares would have made $29 using $5000 of capital, about twice the capital usage as the bull put spread.
Volume Profile Informs Support/Resistance Early
By reading the volume profile, our trader was able to identify a potential support level as early as March 3rd.
Traders without access to volume profile might not recognize that same support zone until March 20, when price had formed two touchpoints that could be connected…
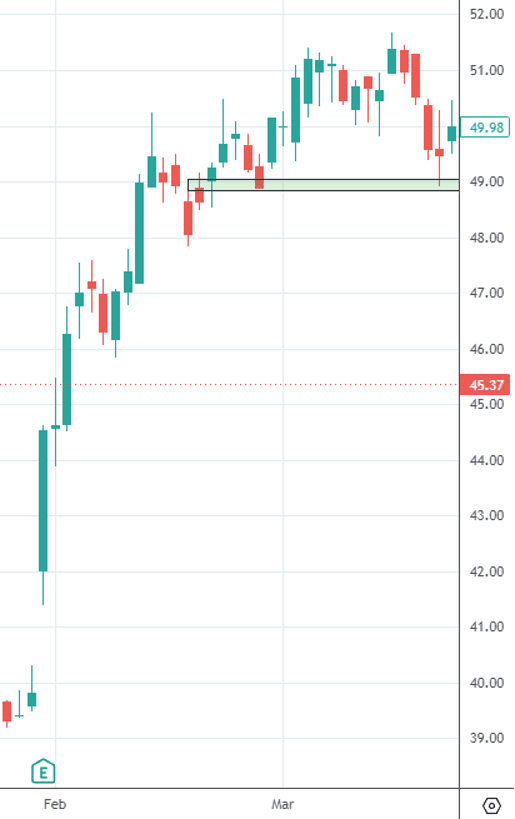
By that time, the volume-profile trader had already entered the trade.
While the traditional chart trader was still waiting for a third touch of the support zone on April 6 to enter a trade:
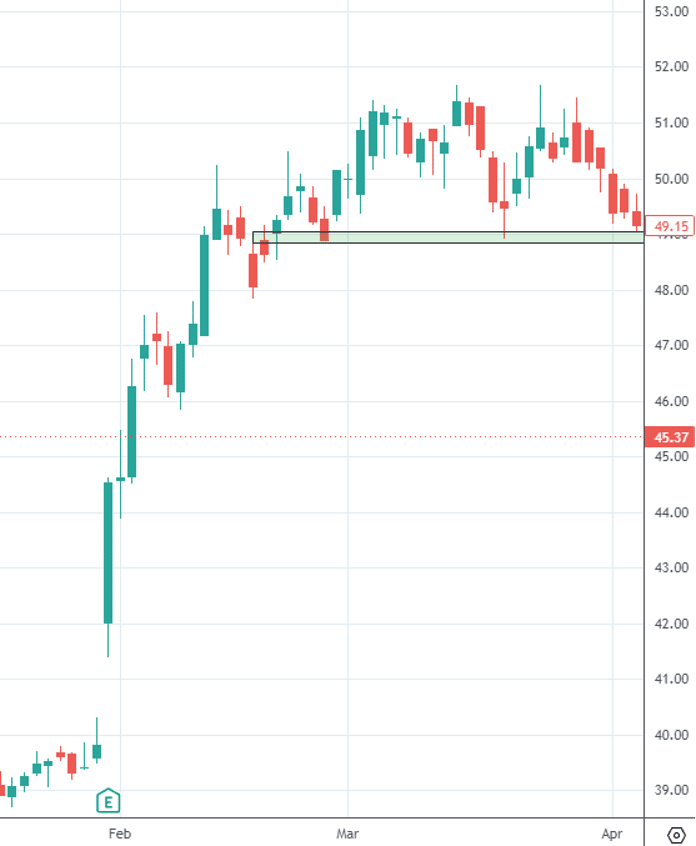
Our volume-profile trader had already taken profit.
Furthermore, the second touch of a support zone has lower probability than the first test.
A virgin POC is a fresh point of control that has not yet been tested.
Each revisit weakens the level as more buy orders are absorbed.
In fact, the April 6 retest of support did not hold.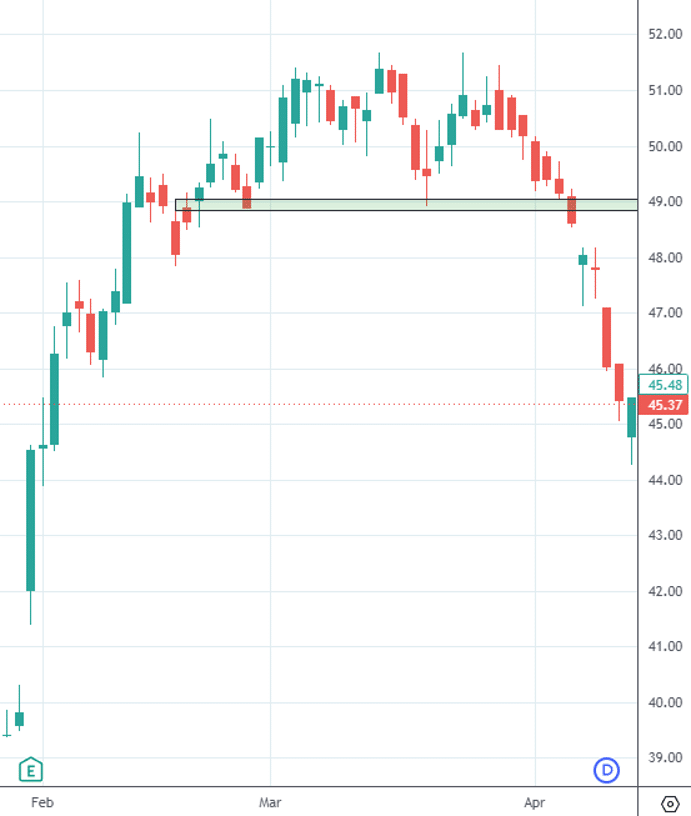
Support Turned Resistance
Our story could end here highlighting the fact that using the volume profile can clue traders of support/resistance levels not seen by traditional charting.
But this chart has more lessons to teach.
When a support zone is breached (especially in a forceful manner seen after April 6), it suggests that sellers at that level were overwhelmingly strong and/or that buyers have abandoned that level.
As a result, that former support zone can now be marked in red as a new resistance level, where a concentration of sell orders may remain.
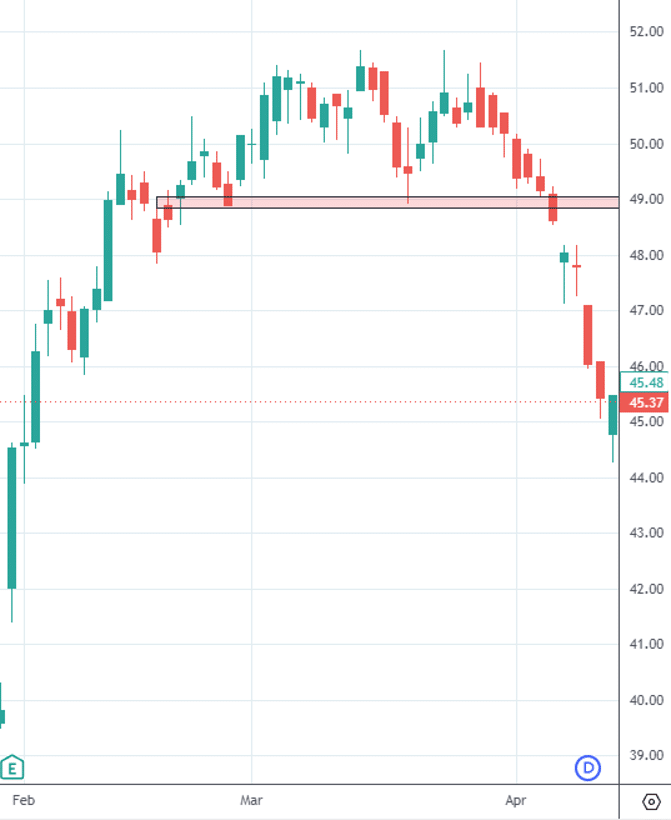
And we wait for price to return up to that level.
It did so on May 27th, when an upper wick of candle poked up into it and got rejected.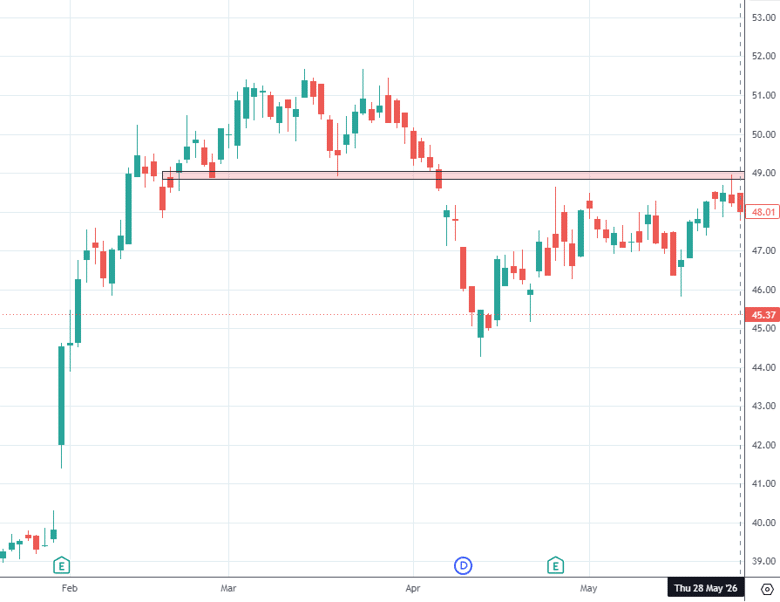
The following day, May 28th, was bearish.
Let’s enter a bear call credit spread near the end of the day:
Date: May 28, 2026
Price: VZ @ $48
Sell ten contracts July 10 VZ $50 call @ $1.37
Buy ten contracts July 10 VZ $52 call @ $0.44
Net Credit: $935
Max risk: $1065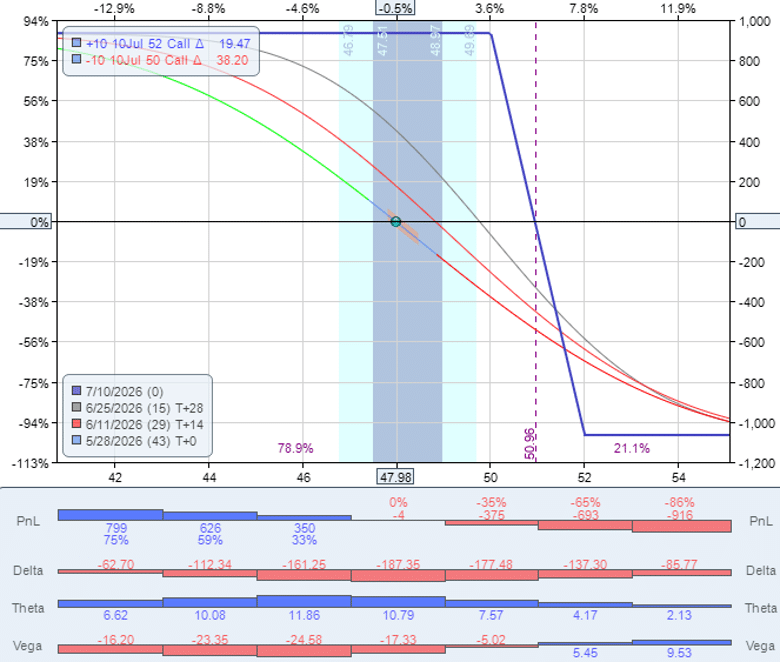
And let’s take profit on June 5th after the big bearish candle which had no follow-thru on the following day: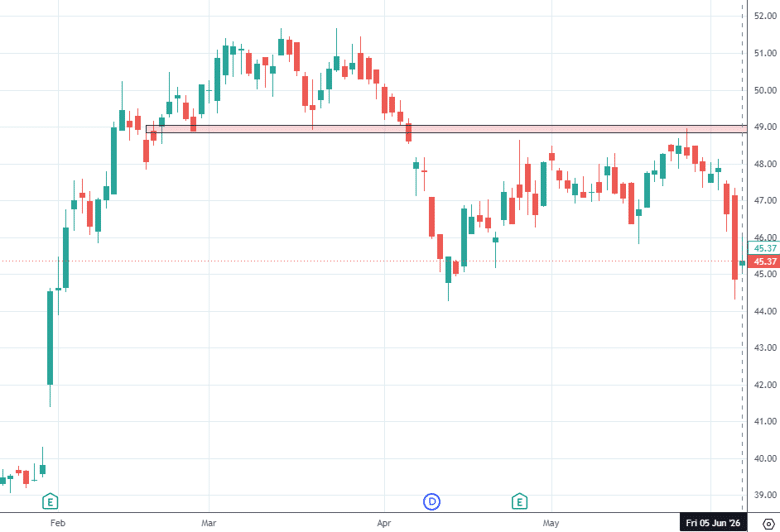
To capture $900 of profit: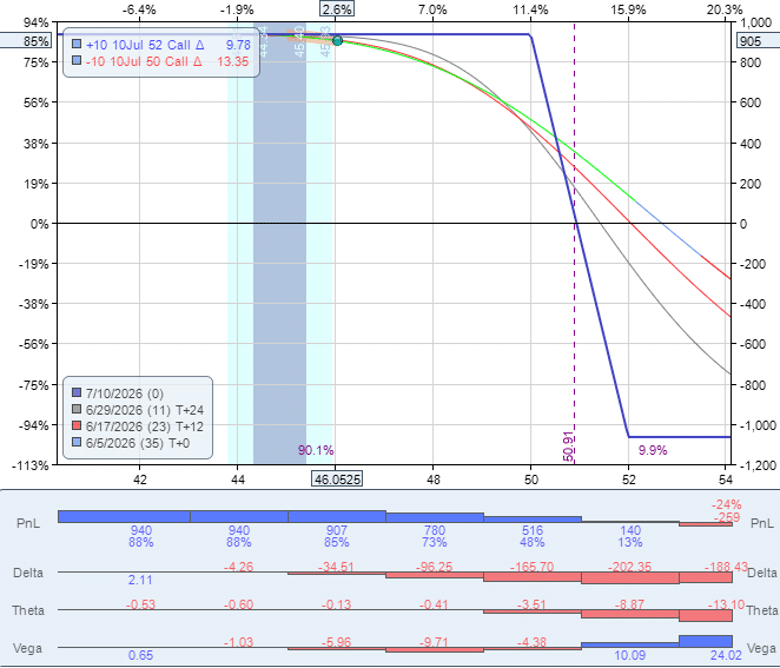
High Volume Nodes
Just curious.
Why did the price stop at the $44.50 level and did not drop any further?
Drawing with the Fixed Volume Profile for all the price action from January to June:
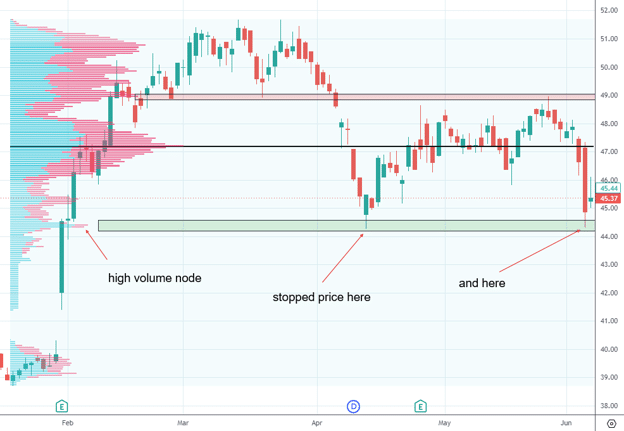
We see that there was a high-volume node at that level acting as support.
Not only the POC can act as support, but high-volume nodes can too.
It pays to be curious.
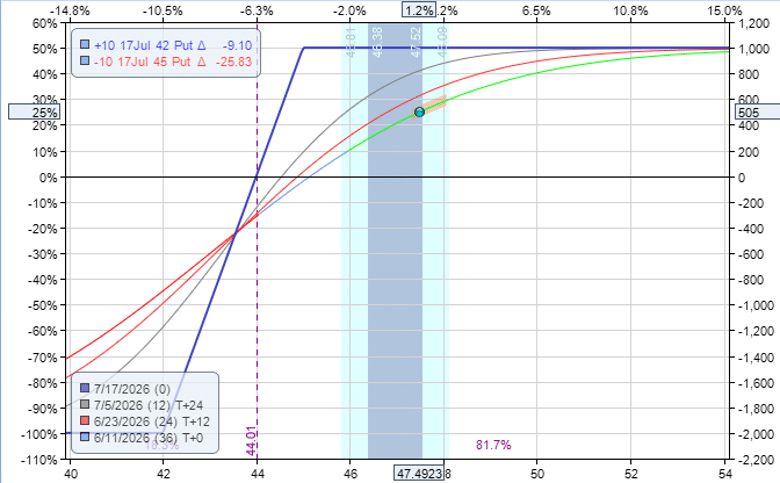
Because now we know to enter a bull put credit spread on Friday June 5th.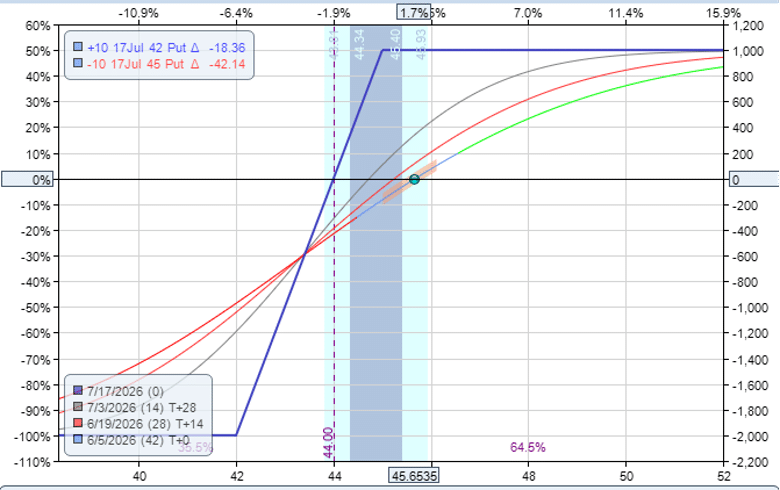
And take profit of $500 six days later:
FAQ
What Is The Best Volume Profile Tool For Finding Support And Resistance?
For most retail traders using TradingView, the Fixed Range Volume Profile is the most practical tool for identifying support and resistance from prior price moves — and it’s available on the free plan.
Draw it over any significant price move to find the POC and high-volume nodes that are likely to act as future support or resistance.
The Session Volume Profile is better for intraday traders who want to see the current day’s developing structure in real time, but requires at least the Essential subscription.
How Does Volume Profile Support And Resistance Differ From Traditional Chart Support And Resistance?
Traditional support and resistance is identified retrospectively — you draw a line after price has already touched a level at least once, ideally twice.
Volume Profile identifies potential support and resistance prospectively, based on where the highest concentration of volume occurred during a prior move.
This can give traders an earlier entry signal before the level has been confirmed by multiple price touches — as the VZ example in this article demonstrates.
Why Does Support Turn Into Resistance After A Breakdown?
When a support level breaks, it means buyers at that level have been overwhelmed by sellers.
The buyers who bought at that level are now holding losing positions and will tend to sell when price returns to their entry level to minimise their losses.
Meanwhile, new sellers who identified the breakdown will use the return to former support as an opportunity to add short positions.
Both groups create selling pressure at the former support zone — which is why it tends to act as resistance on the return visit.
Can Volume Profile Be Used For Options Strike Selection?
Yes — and this is one of its most practical applications for options traders.
Placing the short strike of a bull put spread below a high-volume POC or HVN gives the trade a technical basis for holding.
If the POC at $49 represents a level where a large amount of business was transacted, that level is likely to provide support on a return visit.
Selling a put spread with the short strike below $49 means the trade can withstand a move back to that level and still expire profitably.
What DTE Should I Use For Credit Spreads Based On Volume Profile Analysis?
The examples in this article use 35–45 DTE, which gives the trade enough time for the technical thesis to play out without excessive theta decay working against management flexibility.
Very short DTE (under 21 days) can work but requires more precise timing on the entry — if the support or resistance level takes longer than expected to be tested, you may run out of time.
Longer DTE (60+ days) gives more room but reduces the annualised return efficiency of the trade.
Want to Combine Technical Analysis With Systematic Options Income Trading?
The approach in this article — using Volume Profile to identify high-probability support and resistance, then expressing the view through defined-risk credit spreads — is exactly the kind of edge-based income trading covered in Options Income Mastery.
The course covers strike selection, position sizing, and trade management using both technical and volatility-based analysis.
Conclusion
There is no need to use short-DTE credit spreads.
The ones used in these examples were from 35 to 45 days till expiration.
The profit comes from getting the direction correct, and that is informed by the volume profile and support/resistance analysis.
When you see a strong impulsive move, see where the move initiated from.
That is where a lot of orders sit.
The direction of that impulse tells you whether those orders are buys or sells.
When you see price makes a sharp reversal, check to see if it is bouncing off support or resistance.
If there are a lot of transactions happening at that price level as indicated by the volume profile, it is a good indication of a support/resistance level.
When you see price go right through a support/resistance level, it means that control has switch from one side to another.
Lots of lessons in this one.
We hope you enjoyed this article on using Volume Profile to find support and resistance.
If you have any questions, please send an email or leave a comment below.
Trade safe!
Disclaimer: The information above is for educational purposes only and should not be treated as investment advice. The strategy presented would not be suitable for investors who are not familiar with exchange traded options. Any readers interested in this strategy should do their own research and seek advice from a licensed financial adviser.

Original source: https://optionstradingiq.com/volume-profile-support-resistance/